Pretium’s Third Annual Impact Report

INSIGHTS

Pretium’s Third Annual Impact Report

April 2024

We build for longevity in our investment strategies and across the markets in which we operate.

Sound, sustainable investment principles inform our long-term objectives and create enduring value for our investors, our employees, and the families, businesses, and communities our investments touch.

Learn more in our third annual report on Pretium’s impact and sustainability efforts.

The Strategic Case for CLO Equity

INSIGHTS

CLO Performance Report, March 2024

March 26, 2024

CLO equity provides a unique format to invest in high-yield corporate loans

Collateralized loan obligations are investment vehicles that securitize a diversified portfolio of senior secured corporate loans – sometimes referred to as leveraged loans – and then distribute the loan portfolio’s cashflows to a range of end investors. The equity tranche of a CLO transaction is entitled to all of the principal and interest payments made by the underlying loan portfolio, net of interest and principal payments distributed to the CLO debt securities senior to the equity tranche. Thus, a key attribute of CLO equity, as it relates to the priority of payments received, is that CLO equity receives regular periodic payments representing the excess interest generated by the difference between the loan portfolio income and the CLO debt security cost, on a current basis.

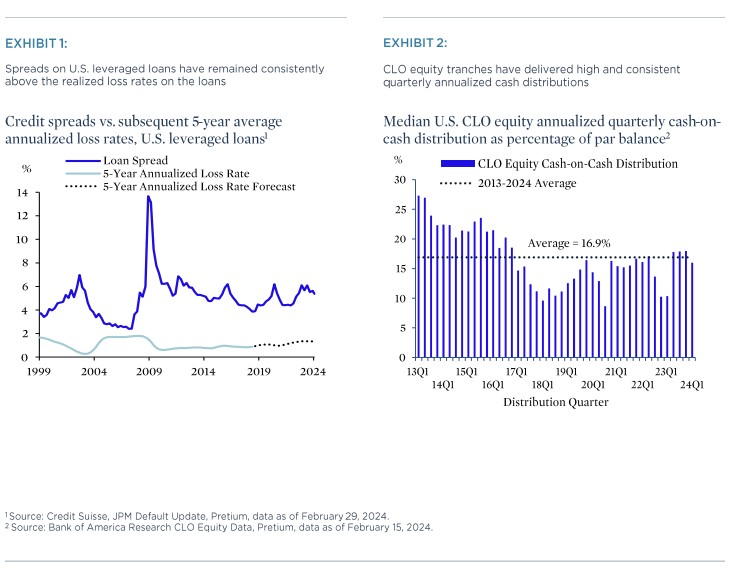
The senior secured, high-yield corporate loans that back CLO transactions have historically been attractive assets to own, as their spreads have remained well above the loans’ realized credit losses. Exhibit 1 below shows that leveraged loan spreads have averaged 5% (500bp) over the past 25 years while leveraged loan losses have averaged only 1% (100bp) over the same period, highlighting the potential for the loans to generate positive long-run excess returns.

exhibit 1 and 2

CLO equity is, in turn, a particularly unique format through which to gain exposure to high-yield corporate loans. The CLO structure – as shown, e.g., in the Appendix of this report – provides non-recourse, non-mark-to-market term leverage, which enhances the baseline yields of the loans themselves, without incurring risks of margin calls which may occur when using more traditional forms of leverage such as repo financing. Additional positive features of the CLO equity asset class include multiple embedded options, such as the option to refinance senior CLO debt when conditions are favorable and the option to actively manage the underlying CLO loan portfolio through asset sales and purchases, and limited interest rate risk exposure due to the floating-rate nature of the CLO assets and liabilities.

The beneficial features of CLO equity listed above have helped the sector to generate high and consistent quarterly cashflow distributions over time. Exhibit 2 above shows that CLO equity cash-on-cash returns have historically averaged 16.9%, annualized, when expressed as a percentage of the equity tranche par value; when these cash distributions are expressed as a percentage of acquisition value (purchase price), they further increase, as new issue equity is typically issued at a discount to par and seasoned secondary market equity often trades at a significant discount to par. As an example, if the equity tranches are acquired in the secondary market at a $90 price, as is often feasible, then the average annual cash-on-cash return as a percentage of purchase price becomes 18.5%; if the tranche acquisition price is $75, then the cash-on-cash return becomes 22.5% annualized.

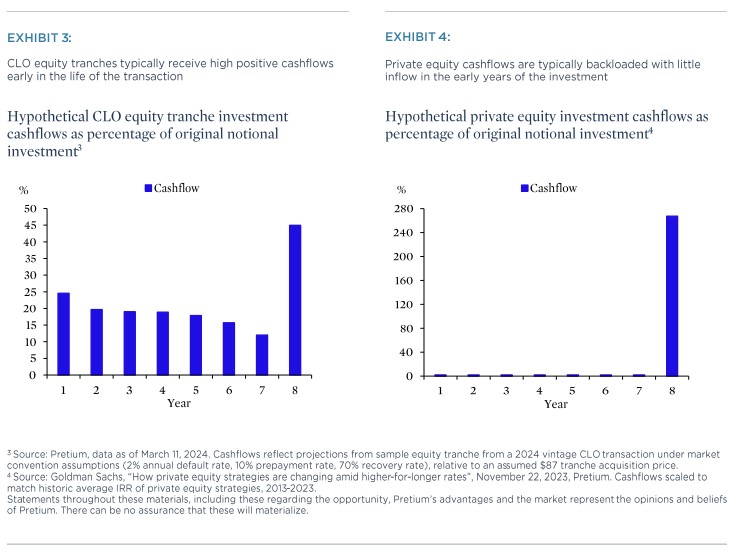
Notably, the distributions to CLO equity usually begin on the first payment date and continue on a quarterly basis over the life of the investment, as is shown in Exhibit 3 for a hypothetical equity tranche. The resulting cash flow profile compares favorably to traditional private equity investments, which commonly exhibit a “J-curve” profile in which the investment delivers negative returns/no cash flow in the initial years of the transaction, hopefully to be offset by positive returns and return of capital in later years as the investment matures, as per Exhibit 4.

exhibit 3 and 4

Growth of U.S. CLO market allows equity investors to allocate selectively

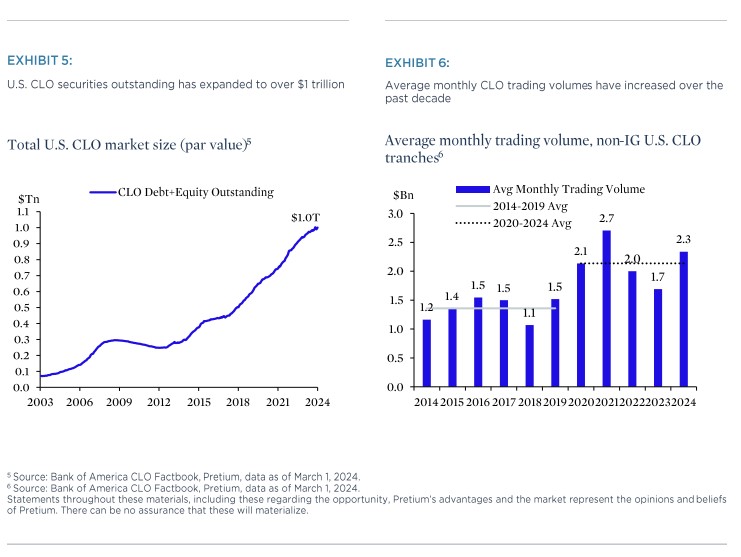
The U.S. CLO asset class has expanded to over $1 trillion of securities outstanding, from less than $500 billion in 2017, making CLOs now the largest securitized credit asset class in the U.S. (Exhibit 5). The growth of the CLO market is in large part a consequence of the sector’s historic success in delivering solid returns to investors through multiple cycles including the global financial crisis and COVID-19, while providing a dependable source of financing to a large and growing segment of corporate borrowers. The growth of the CLO market has led to improved trading liquidity for the asset class (e.g., per Exhibit 6) and makes it possible for active CLO equity investors to focus upon specific sub-segments of the market in order to target particularly compelling risk-reward profiles while still remaining discriminating in terms of security selection. For example, as market volatility and price dislocation increased in 2022 and 2023, Pretium adjusted its allocation strategy by overweighting secondary vs. primary market CLO equity positions and by overweighting CLO equity tranches backed by relatively defensive, lower risk loan portfolios. To the extent price dislocation moderates in 2024 and financing markets continue to become more accommodative, Pretium would expect to become more active in new issue markets again in order to lock in favorable debt terms which would benefit new issue CLO equity.

exhibit 5 and 6

Conclusion: CLO equity is an attractive alternative for asset allocators looking to diversify their private credit exposure

CLO equity tranches have the potential to generate double digit returns over the long term while generating high current cash flow. The sector offers insulation from an uncertain future for interest rates and the large market footprint allows active investors to generate excess returns through tactical asset selection. Pretium believes the risk/reward characteristics of CLO equity to be a complementary component to any private credit allocation strategy today.

Appendix: Sample CLO Transaction Structure

CLO transaction structures distribute the principal plus interest cashflows from a pool of ~200 senior secured corporate loans to a range of equity and debt tranches.

sample clo transaction structure

Jerry Ouderkirk – Senior Managing Director, Head of Structured Credit

Jerry Ouderkirk is a Senior Managing Director and Head of Structured Credit at Pretium, where he has overall responsibility for the Firm’s corporate credit platform. In addition to overseeing and expanding the Firm’s CLO platform, Mr. Ouderkirk is building out numerous investing businesses across structured credit including Structured Corporate Credit.

Mr. Ouderkirk joined Pretium in 2017 with 20 years of experience building and committing capital around structured credit products and platforms. Prior to joining Pretium, Mr. Ouderkirk was a Partner at Goldman Sachs, where he started the Institutional Lending Group for Goldman Sachs Bank USA which oversaw the Firm’s discretionary lending and investing in the bank. He previously served as Global Co-Head of Structured Credit Trading, where he oversaw multiple capital committing businesses and started Goldman’s CLO Trading business, which he ran for more than 12 years.

Mr. Ouderkirk is a member of the Firm’s Executive Committee. He received a BA with honors in English and Economics from Colgate University. Mr. Ouderkirk serves on the Board of CitySquash in New York.

Confidentiality and Other Important Disclosures

This confidential presentation was prepared exclusively by Pretium for the benefit and internal use of the party to whom it is directly addressed and delivered (the “Recipient”). None of the materials, nor any content, may be altered in any way, transmitted to, copied, reproduced or distributed in any format in whole or in part to any other party without the prior express written consent of Pretium. As used in this presentation, “Pretium” refers to Pretium Partners, LLC and/or its affiliates.

Pretium’s Credit investment strategies are focused on corporate credit, structured products collateralized by corporate credit, distressed debt and equity and legal opportunities financing. The team invests in broadly syndicated loans, debt and equity of public and private companies, as well as securities issued by CLOs. Investments in high yield securities are subject to greater risk of loss of principal and interest than higher-rated securities and are generally considered to be predominantly speculative with respect to the issuer’s capacity to pay interest and repay principal. Investments in distressed situations expose the investor to the difficulty in obtaining information as to the issuer’s true condition; legal risk, including laws relating to fraudulent conveyances, voidable preferences, lender liability, and bankruptcy; litigation risk; and liquidity risk. In addition, accounts will not be diversified among a wide range of types of securities, industry, markets, or countries. Litigation finance depends on whether the cases in which the fund invests will be successful, will pay the targeted returns and will pay those returns in the anticipated time. Assessing the values, strengths and weaknesses of a case is complex and the outcome is not certain. Should cases, claims, defenses or disputes in which the fund invests prove to be unsuccessful or produce returns below those expected, the performance of the fund could be materially adversely affected. Furthermore, laws and professional regulations in litigation funding can be complex and uncertain and details of certain cases are unlikely to be disclosed because of confidentiality and other restrictions.

There can be no assurance that Pretium’s objectives will be achieved, that any risk management will adequately protect against downside losses, or that an investor will receive any return on its investment. An investment should only be considered by persons who can afford a loss of their entire investment. Past activities of investment entities sponsored by Pretium provide no assurance of future results. Past or targeted performance is not a guarantee, projection or prediction and is not necessarily indicative of future results.

These materials do not constitute, or form part of, any offer to sell or issue interests in an investment vehicle or any other entity. Any such offer or solicitation will be made solely by means of a definitive offering document, which will describe the actual terms of any securities offered and will contain material information regarding the securities. Any information contained herein will be superseded by information delivered to Recipient as part of an offering document. No representation, warranty or undertaking, express or implied, is given as to the accuracy or completeness of the information or opinions contained herein.

Past performance is not necessarily indicative of future results and there can be no assurance that targeted returns will be achieved. There can be no assurance that Pretium will achieve results comparable to or that the returns generated will equal or exceed those of other investment activities of Pretium or that Pretium will be able to implement its investment strategy or achieve its investment objectives. Pretium does not make any representation or warranty, express or implied, regarding future performance.

Certain information contained in these materials constitute “forward-looking statements,” which can be identified by the use of forward-looking terminology such as “may,” “will,” “should,” “seek,” “expect,” “anticipate,” “project,” “estimate,” intend,” continue,” “target,” “plan,” “believe,” the negatives thereof, other variations thereon or comparable terminology. Due to various risks and uncertainties, actual events or results of the actual performance of an investment vehicle or strategy may differ materially from those reflected or contemplated in such forward-looking statements.

Certain information contained in this presentation has been obtained from published and non-published sources prepared by third parties, which, in certain cases, have not been updated through the date hereof. While such information is believed to be reliable, Pretium has not independently verified such information nor does it assume any responsibility for the accuracy or completeness of such information. Except as otherwise indicated herein, the information, opinions and estimates provided in this presentation are based on matters and information as they exist as of the date these materials have been prepared and not as of any future date and will not be updated or otherwise revised to reflect information that is subsequently discovered or available, or for changes in circumstances occurring after the date hereof.

These materials are intended to assist the Recipient in connection with its due diligence and to assist the Recipient in understanding the strategies that Pretium intends to pursue to seek to maximize portfolio performance. They are not intended as a representation or warranty by Pretium as to the actual composition or performance of any future investments that would be made by Pretium. Assumptions necessarily are speculative in nature. It is likely that some or all of the assumptions underlying the potential investments will not materialize or will vary significantly from any assumptions made (in some cases, materially so). The Recipient should understand such assumptions and evaluate whether they are appropriate for its purposes.

Recipients should note that COVID-19 has, among other things, significantly diminished global economic production and activity of all kinds and has contributed to both volatility and a decline in all financial markets. The ultimate impact of COVID-19 — and the resulting precipitous and near-simultaneous decline in economic and commercial activity across several of the world’s largest economies — on global economic conditions, and on the operations, financial condition and performance of any particular industry or business, is impossible to predict, although ongoing and potential additional materially adverse effects, including a further global or regional economic downturn (including a recession) of indeterminate duration and severity, are possible. The extent of COVID-19’s impact will depend on many factors, including the ultimate duration and scope of the public health emergency and the restrictive countermeasures being undertaken, as well as the effectiveness of other governmental, legislative and financial and monetary policy interventions designed to mitigate the crisis and address its negative externalities, all of which are evolving rapidly and may have unpredictable results. Even if and as the spread of the COVID-19 virus itself is substantially contained, it will be difficult to assess what the longer-term impacts of an extended period of unprecedented economic dislocation and disruption will be on future macro- and micro-economic developments, the health of certain industries and businesses, and commercial and consumer behavior.

Pretium’s Housing Insights, November 2023

INSIGHTS

Pretium’s Housing Insights, November 2023

November 2023

The popular housing narrative overstates the mortgage rate lock-in effect

Structural supply-demand imbalance is the reason home prices are rising, not higher mortgage rates

Despite the most substantial mortgage rate impact on homebuyers in the modern history of housing, US single-family home prices are up roughly 5% year-to-date through the third quarter.1 The surprising resilience of home prices has confounded housing observers and led most housing narratives to focus in on the mortgage rate lock-in effect as the root cause of rising home prices. Even Federal Reserve officials have publicly stated that rising interest rates have contributed to rising home prices through the mortgage rate lock-in effect.2 Mortgage rate lock-in as a driver of reduced mobility is a documented phenomenon3 and it is likely that some homeowners have not listed their homes as a result of the sharp increase in mortgage rates; however, we believe the lock-in phenomenon has been overemphasized in the popular housing narrative. Moreover, the argument that mortgage rate lock-in aggravates housing’s supply-demand imbalance (and therefore increases home prices) confuses listings of existing homes for housing inventory, in our view. If rates fall, Pretium believes it is more likely that housing’s supply-demand imbalance will incrementally worsen, not improve. As we have written previously, the pandemic structurally increased demand for single-family homes after a prolonged period of underproduction.4 This structural supply-demand imbalance remains a more likely candidate for why home prices have been resilient during 2023 rather than the mortgage rate lock-in effect.

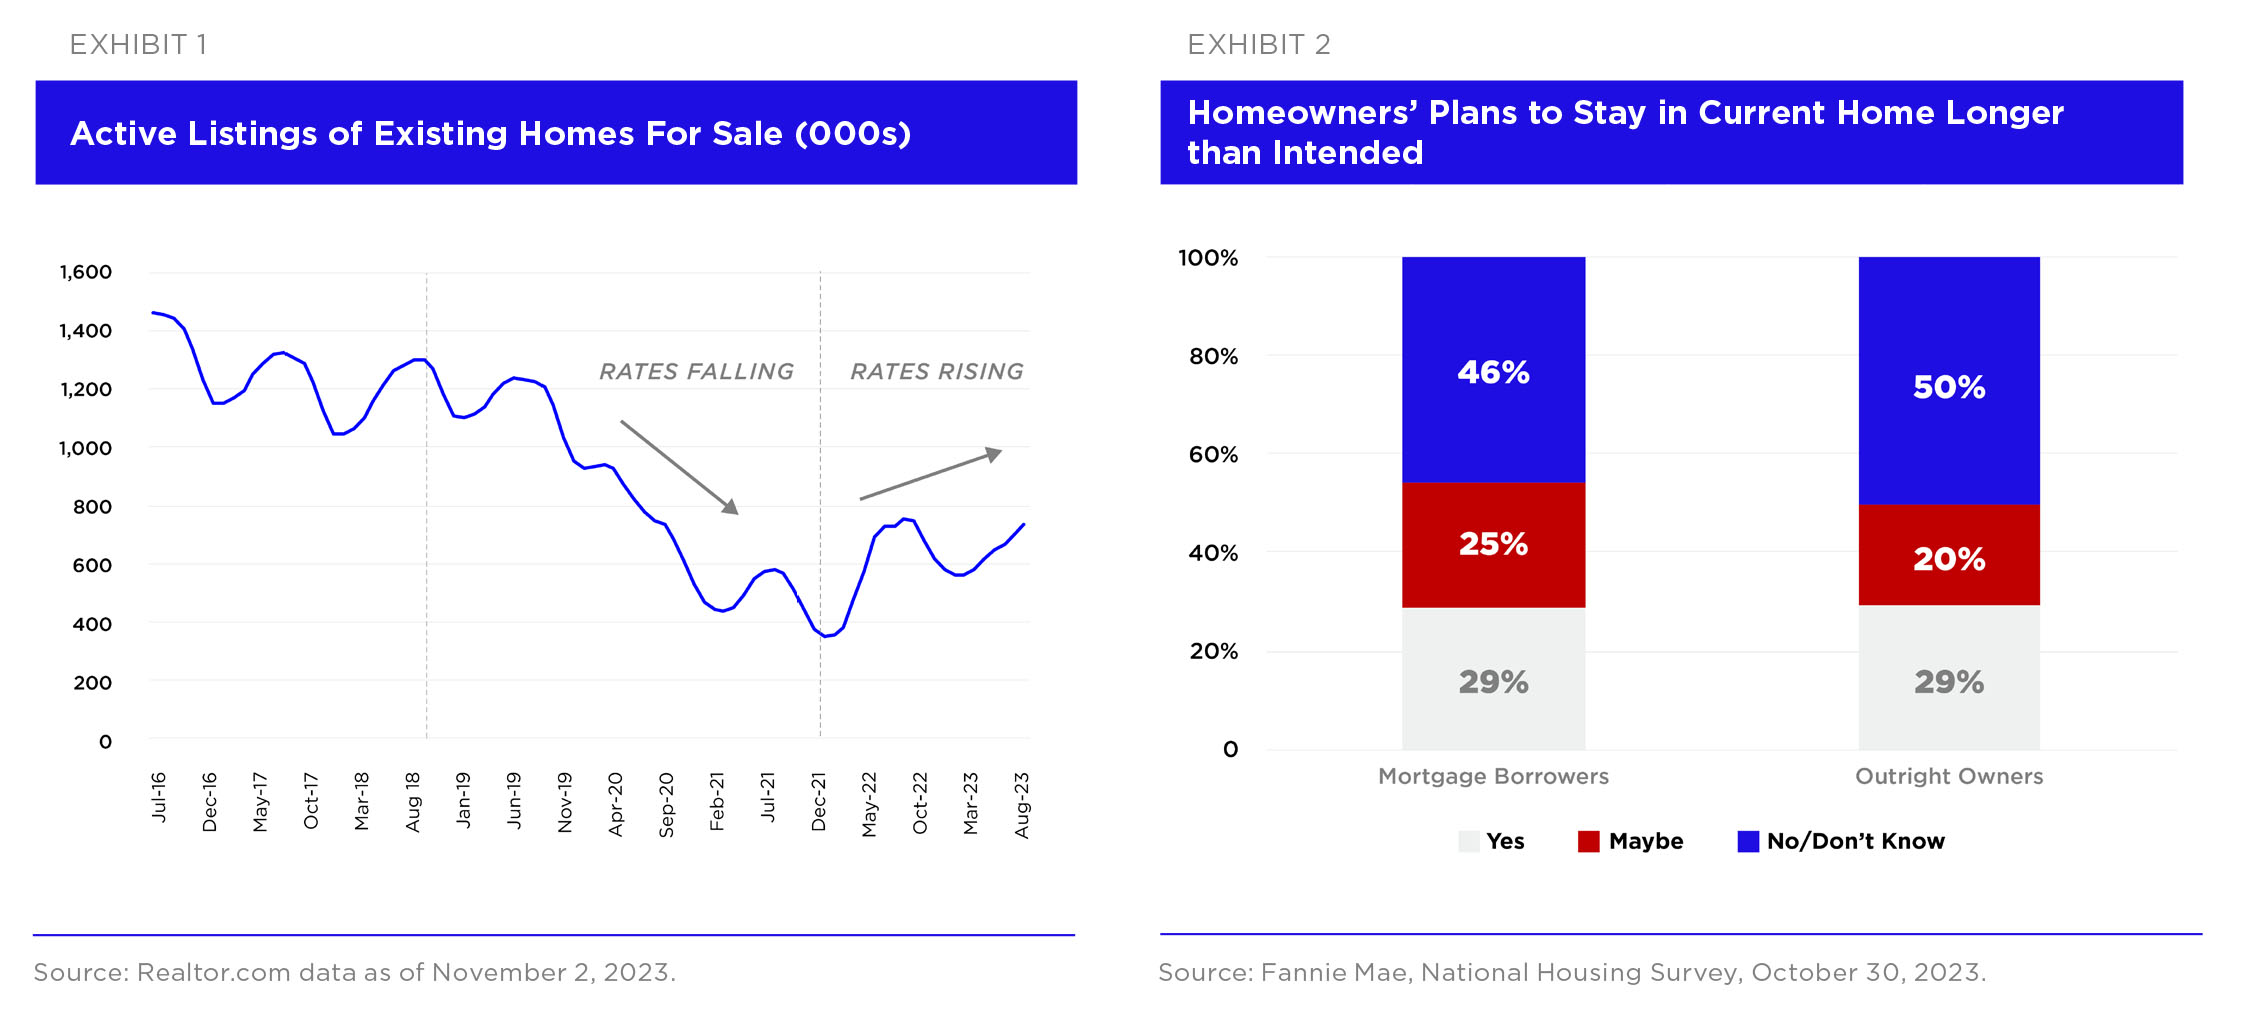
The main argument of the mortgage rate lock-in thesis is that listings of existing homes have fallen due to higher rates but Exhibit 1 shows that this isn’t the case. Active listings fell from 2019-2021 as mortgage rates fell and have been increasing since the beginning of 2022. The pace of transactions has fallen at a faster rate than the pace of new listings, driving up both overall resale listings and months of supply. Fannie Mae’s National Housing Survey asked earlier this year whether mortgage rates were a factor in homeowners’ plans to stay longer in their current homes and the results “…suggest that a fairly strong majority of mortgage borrowers’ future moving plans may not be affected by their mortgage rate”.5 As shown in Exhibit 2, there was little difference in the moving intentions of mortgage borrowers vs. outright owners.

An important underlying assumption of the mortgage rate lock-in effect thesis is that homeowners’ choice not to list their homes reduces housing inventory; however, if rates fell and a greater number of homeowners listed their homes, they would be both buyers and sellers. Furthermore, according to the lock-in thesis these households would largely be discretionary buyers/sellers and therefore unlikely to accept offers that would cause home prices to decline. Finally, to the extent that most homeowners cannot perfectly time the sale of their current home and the purchase of their new home, increased transactions by locked-in homeowners would likely lead to some households temporarily occupying two homes thereby decreasing overall housing inventory.


Statements throughout the research above represent the opinions and beliefs of Pretium. There can be no assurance that these will materialize.


  1. CoreLogic, US Home Price Insights as of November 7, 2023.
  2. “Higher Rates Contribute to Rising Home Prices, Fed’s Harker Says”, Bloomberg, October 16, 2023.
  3. “Mortgage Lock-In, Mobility, and Labor Reallocation”, Fonseca and Liu, June 2023.
  4. “In forecasting home prices, the last housing cycle is a poor guide for this one”, Pretium Housing Insights, September 21, 2022.
  5. “’Lock-In Effect’ not the only reason for housing supply woes”, Fannie Mae as of October 30, 2023.

Pretium’s Housing Insights, October 2023

INSIGHTS

Pretium’s Housing Insights, October 2023

October 2023

The share of US rental housing that is single-family has been falling since 2014

SFR is the only major real estate asset class to see supply shrink in recent years

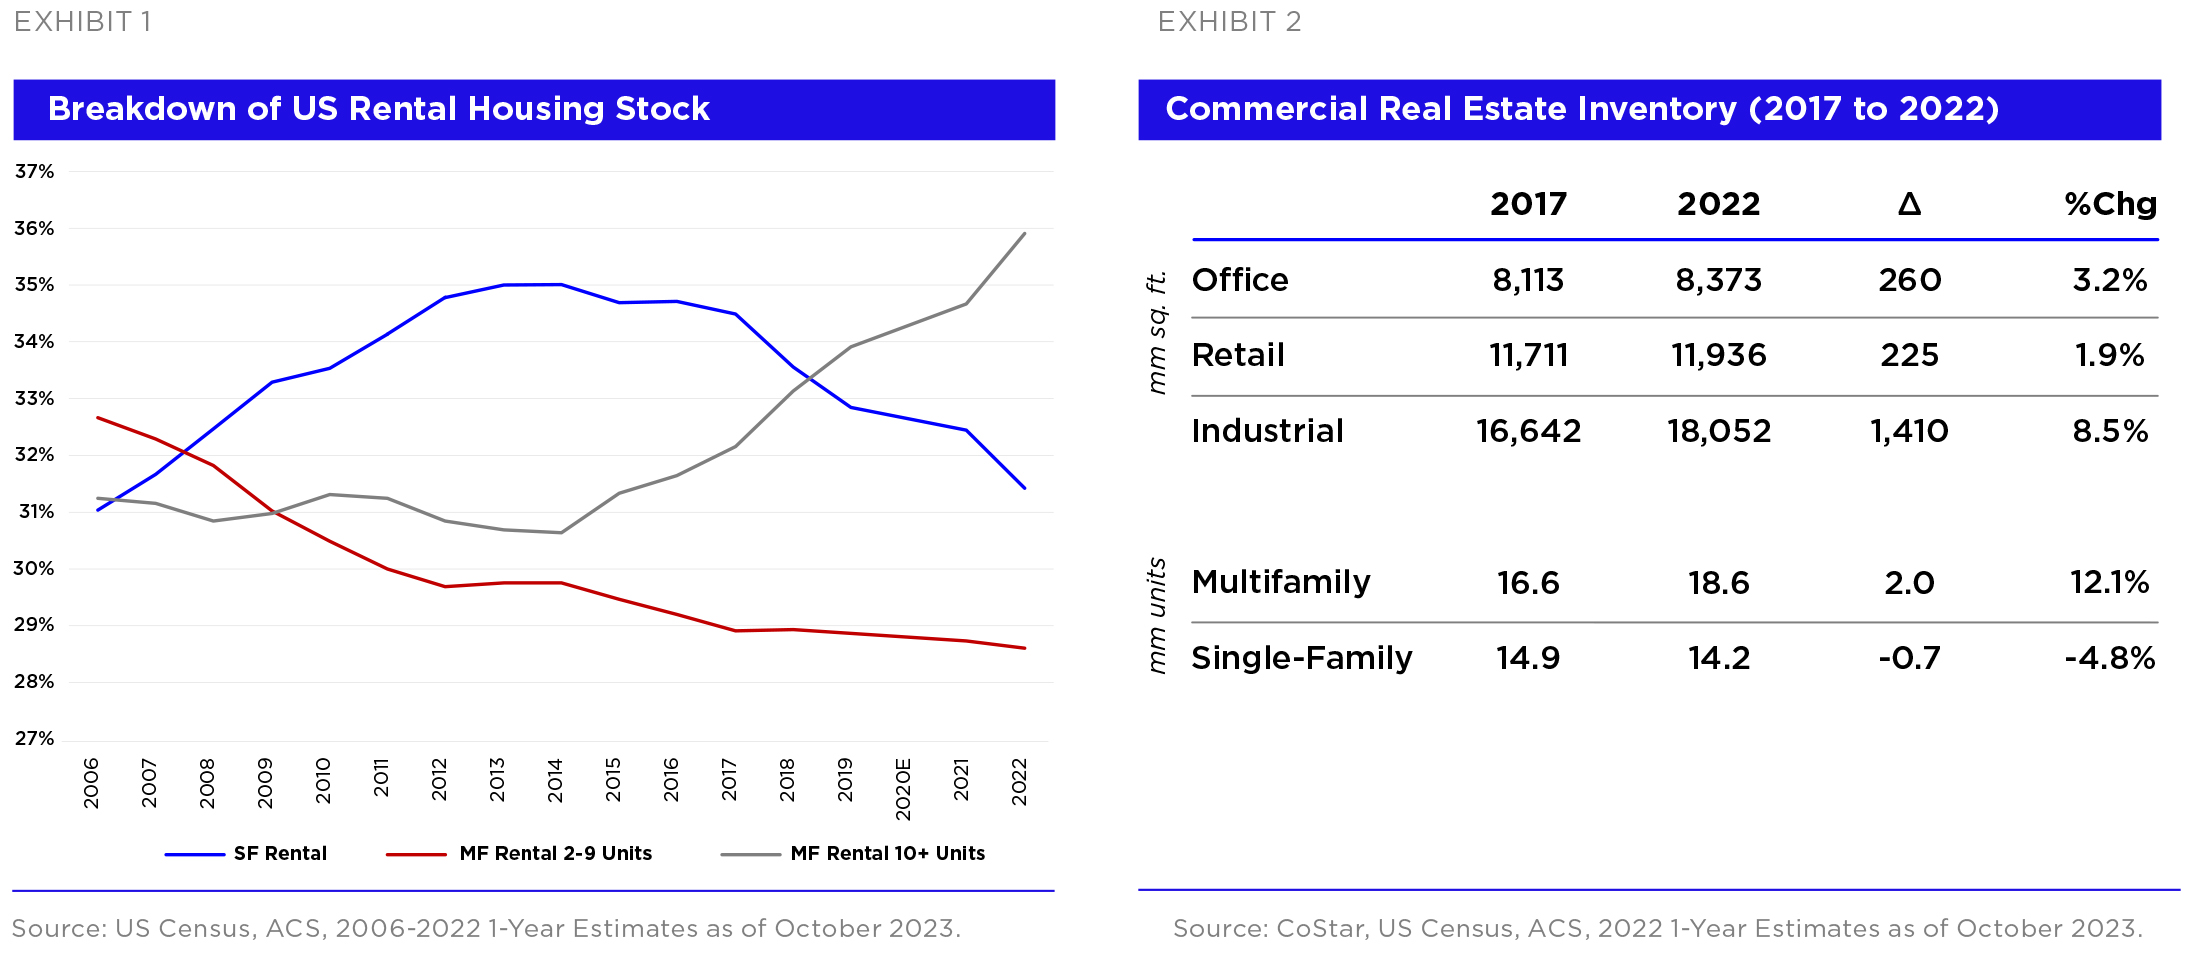
Measuring single-family rental supply is important to evaluating supply-demand fundamentals; however, there is limited data on the subject. There are several frequently quoted sources that attempt to measure investor buying activity;1 however, they don’t accurately capture trends in supply because they mostly ignore sales of single-family rentals back to the homeownership market; moreover, the difficulty of working with tax and county records results in widely varying conclusions about investor buying activity. We explored this in the October 2022 Pretium Housing Insights.2 The US Census American Community Survey (ACS) provides the only national annual count of the number of single-family rentals in the US. 2022 ACS data was recently released, and it shows that the supply of single-family rentals continued to decline last year.3 The overall supply of single-family rentals has now been falling for six consecutive years, including through the pandemic. Combined with multifamily supply that has increased meaningfully over the past decade, single-family homes have accounted for a steadily shrinking share of US rental housing since 2014, as shown in Exhibit 1. At 31.4%, single-family rental share in 2022 is almost as low as it was in 2006 when home ownership was near all-time highs.4

The long-term trend of declining single-family rental supply stands in contrast to supply trends for other major US real estate asset classes, which have all seen net supply growth over the past five years including through the pandemic. As shown in Exhibit 2, Industrial has added 1.4 billion in square footage over the past five years representing 8.5% growth. The multifamily sector has seen a net increase in units of 2 million or 12.1%. Robust supply growth in the asset types that investors have most focused on makes sense; however, it is more surprising that office and retail have also experienced net growth in square footage of 260 million (+3.2%) and 225 million (+1.9%), respectively, over the past five years. We described in last month’s Pretium Housing Insights5 how investment in single-family housing has grown over the long-term; however, ACS data reveals that most of this investment has gone towards owneroccupied housing, not rental housing. Single-family rental stock has shrunk by more than 700,000 over the past five years, or a decrease of 4.8% while single-family owned stock has increased by roughly 7 million.6 Overall, the increase in investor interest in single-family rentals in recent years hasn’t been sufficient to drive supply higher. Looking ahead, continued home price growth and economic/rate volatility are likely to depress single-family rental supply further in the coming years as smaller investors remain motivated to sell more homes than they buy.


Statements throughout the research above represent the opinions and beliefs of Pretium. There can be no assurance that these will materialize.


  1. CoreLogic, US Home Investor Share as of August 17, 2023; Redfin, Real Estate Investors Data as of August 30, 2023; National Association of Realtors, Impact of Institutional Buyers as of May 2022; Freddie Mac, Drivers of Home Price Growth as of June 9, 2022.
  2. Pretium Housing Insights, “Investor activity in housing had no discernible impact on homeownership during the pandemic”, October 2022.
  3. US Census, American Community Survey 2022 1-Year Estimates as of September 14, 2023.
  4. US Census, Housing Vacancies and Homeownership as of August 2, 2023.
  5. Pretium Housing Insights, “Resilient single-family home prices have diverged from commercial real estate prices”, September 2023.
  6. US Census, American Community Survey 2017 and 2022 1-Year Estimates as of September 14, 2023

Pretium’s Housing Insights, September 2023

INSIGHTS

Pretium’s Housing Insights, September 2023

September 2023

Resilient single-family home prices have diverged from commercial real estate prices

Supply-demand imbalance has supported home prices despite record rate shock

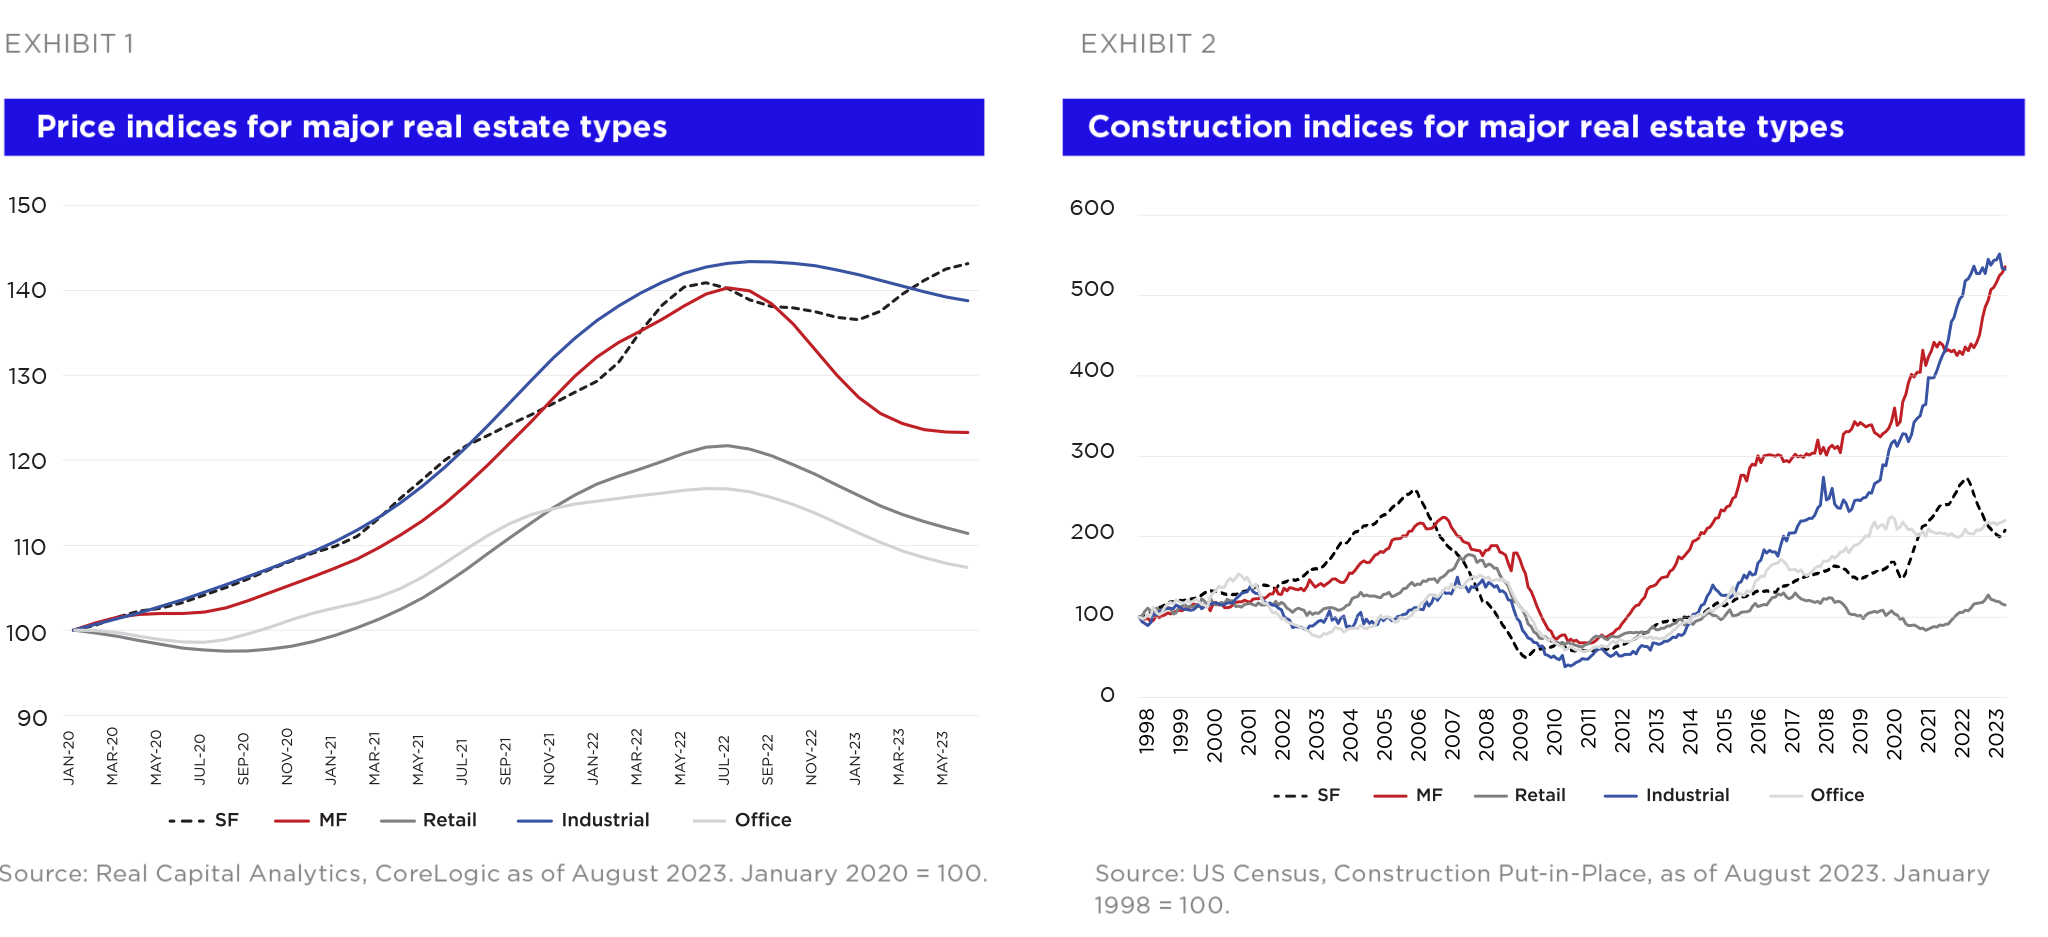
Since the Federal Reserve began its campaign to raise interest rates in early 2022, there has been a marked divergence between the price trends of single-family and traditional commercial real estate. Major commercial property price indices show declines from recent peak values of as much as 10-15%1 ; meanwhile, single-family residential prices declined only briefly during 2H22 and have gone on to set new all-time highs during 2023.2 This price divergence is illustrated in Exhibit 1 and is a departure from prior rate cycles when different real estate sub-sectors had similar rate sensitivities.

Differing financing structures is one widely discussed factor that has likely created greater rate sensitivity for commercial real estate – its financing is typically shorter in term and relies more on floating interest rates. More than 40% of commercial real estate debt matures through 2025; furthermore, roughly one-third is floating rate.3 For single-family homes, 80-90% of mortgage loans originated over the past decade have had fixed 30-year rates with most of the remainder fixed for either 5 or 7 years.4 While financing differences are important, they don’t fully explain why single-family home prices have set new highs despite the largest rate shock in the modern history of US housing. A less discussed but potentially more important factor explaining the surprising resilience of singlefamily prices is a more favorable supply-demand dynamic when compared to commercial real estate.

The pandemic has likely structurally increased demand for housing, especially single-family homes.5 In terms of supply, single-family housing has seen less investment relative to demand since the Great Financial Crisis (GFC). This is illustrated in Exhibit 2, which compares construction spending for different real estate asset types. Multifamily and industrial have emerged as the two pillars of most investors’ real estate strategies and in response investment in new construction has increased more than fivefold over the past quarter century. By contrast, fundamentals for retail and office have proven more challenging and construction has grown slowly. Single-family construction grew during the mid-2000s, but it has seen slower growth during the post-GFC period. Overall, single-family investment has grown in-line with office investment despite a stronger demand profile.

Within single-family housing, single-family rentals have experienced a net reduction in supply over the past few years as described in the October 2022 Pretium Housing Insights.6 Single-family rentals are arguably the only real estate asset type to have seen supply shrink over the past few years. Looking ahead, Pretium expects that favorable supply-demand dynamics will continue to underpin single-family fundamentals in the coming years, both in terms of rent and price growth.


Statements throughout these materials, including these regarding the opportunity, Pretium’s advantages and the market represent the opinions and beliefs of Pretium. There can be no assurance that these will materialize.


  1. Real Capital Analytics, Commercial Property Price Indices as of July 20, 2023; Green Street, Commercial Property Price Index as of August 4, 2023.
  2. CoreLogic, Home Price Index as of September 5, 2023.
  3. Mortgage Bankers Association, Quarterly Commercial/Multifamily Mortgage Debt Outstanding as of June 29, 2023.
  4. CoreLogic, “Rising Rates Lead to Increase in Adjustable-Rate Mortgage (ARM) Activity”, June 26, 2023.
  5. Pretium Housing Insights, “Increased long-distance migration persisted in 2022”, January 2023.
  6. Pretium Housing Insights, “Investor activity in housing had no discernible impact on homeownership during the pandemic”, October 2022.

Is CLO Outperformance Sustainable?

INSIGHTS

CLO Performance Report, August 2023

August 11, 2023

A portfolio of U.S. CLO equity and CLO BB debt securities should outperform HY bonds across a variety of potential future economic scenarios

Introduction

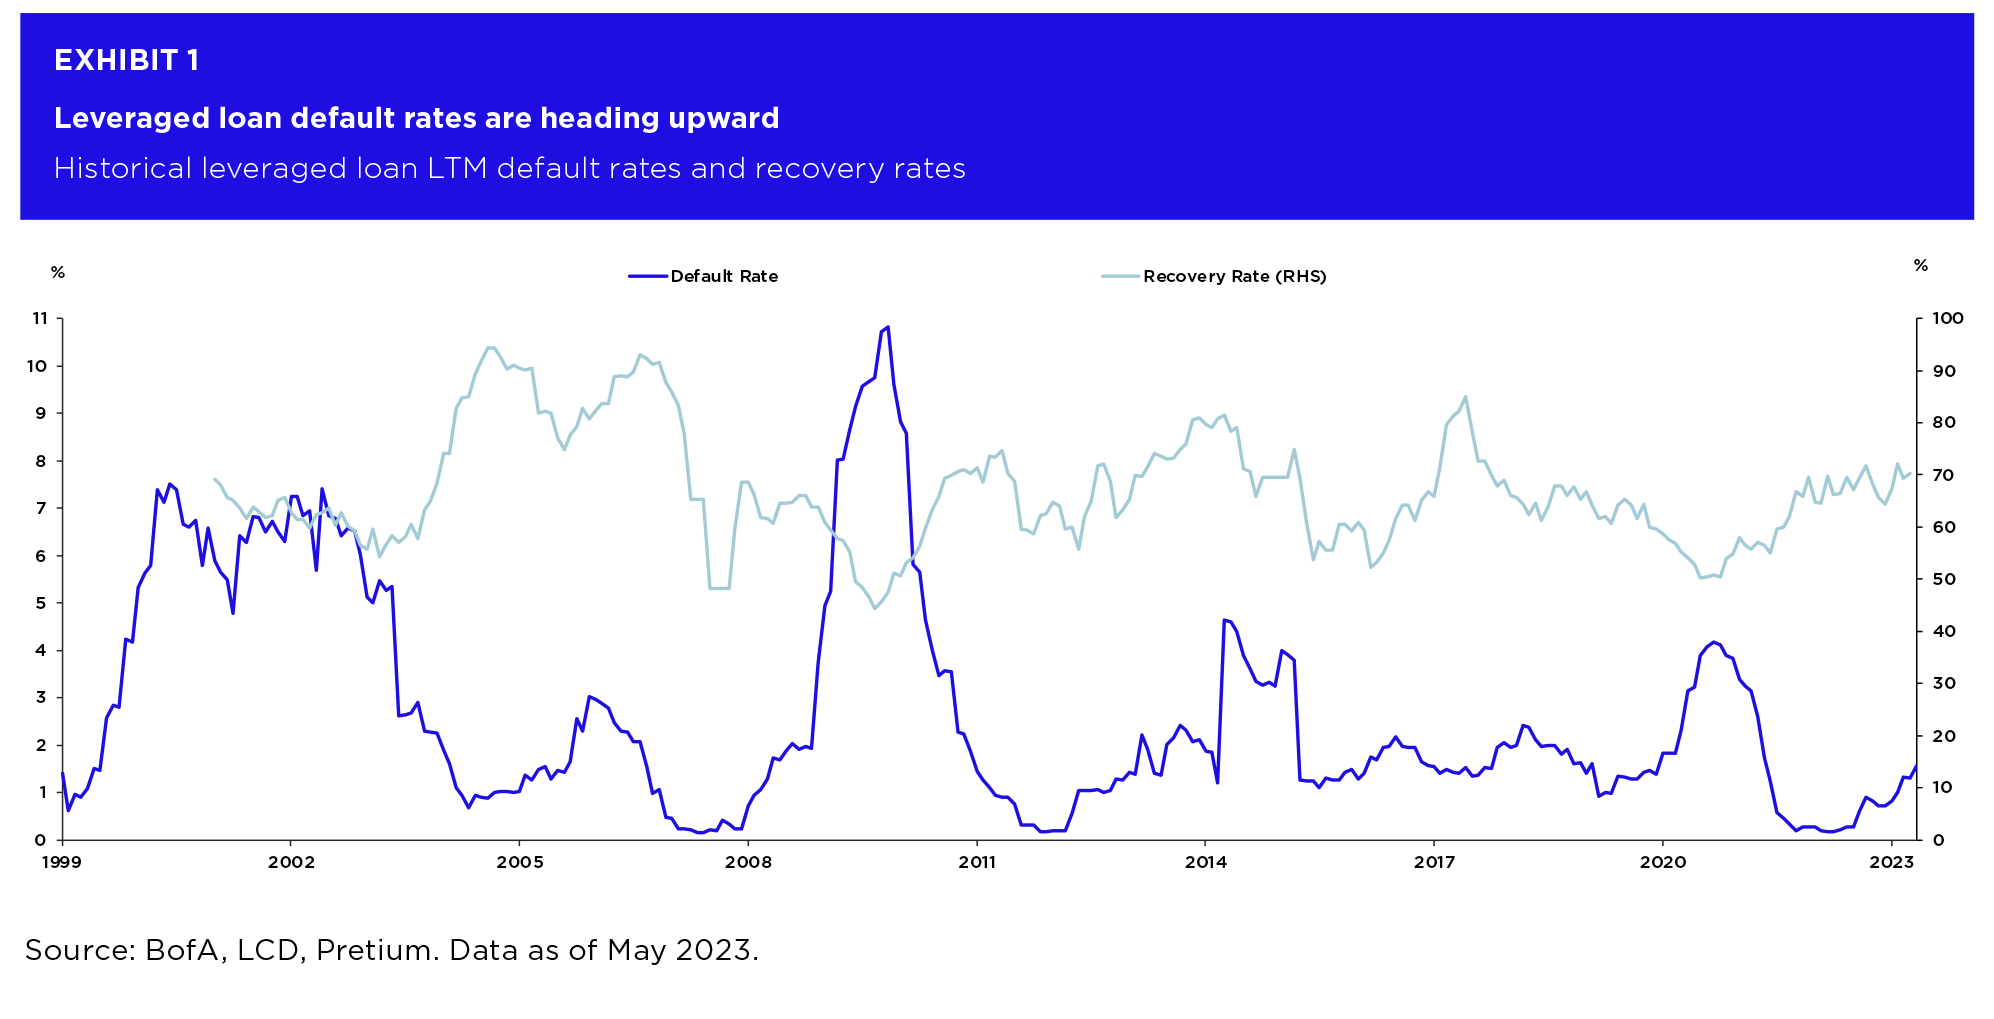
The junior portion of the CLO capital structure has seen solid performance so far in 2023. Over the course of the past several months, Pretium has highlighted this outperformance and made the argument that CLO mezzanine securities were undervalued relative to HY single-name credit, supporting this latter point by comparing the currently wide CLO BB spreads to the historical spread relationship the two asset classes have traditionally maintained. Given the uncertainty surrounding where the economy and the Federal Reserve may go from here, we have received inquiry from our investor base as to whether or not we view this outperformance as sustainable. In summary, we believe it is. Pretium believes that current CLO mezzanine and equity pricing reflects worst-case assumptions related to forward defaults and recoveries. While Pretium expects loan default rates to rise and recovery rates to remain depressed, we believe that current CLO spread and yield levels more than compensate for the fundamental strain that credit markets have already begun to realize and are likely to continue to experience over the coming quarters (Exhibit 1 below).

CLO BBs and CLO equity provided +8.6% and +7.6%, respectively, in (non-annualized) total returns over the first six months of the year vs. just +4.8% for HY corporate bonds1. Pretium believes this strong YTD performance for CLO instruments is sustainable across a variety of possible forward market outcomes. The market environment in the first half of 2023 reflected only muted spread changes and close to flat point-to-point long-term interest rate moves. Thus, the strong 23H1 CLO results for that period reflect what we see as only slightly above average expected returns for a sector which entered the year offering particularly generous spreads and yields.

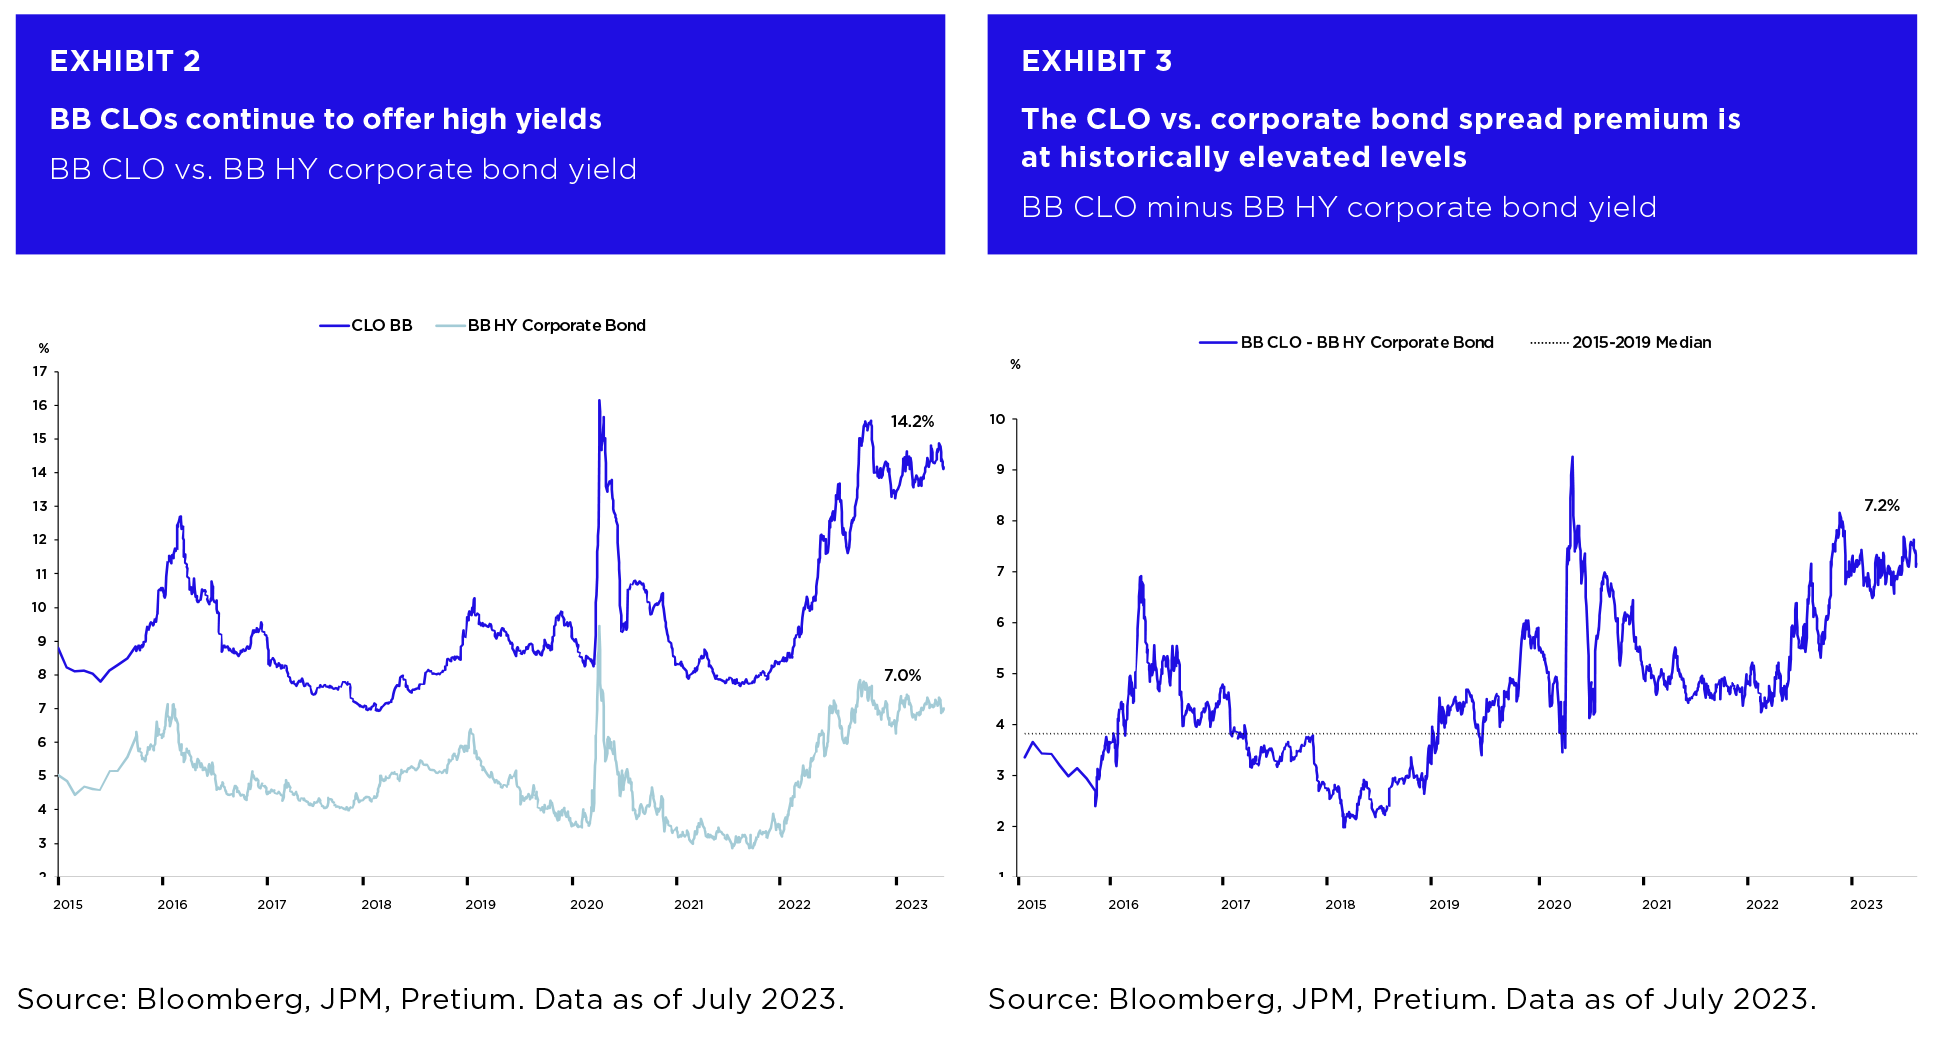
BB CLOs began 2023 with average yields of approximately 14%, reflecting SOFR margins at the time of over 900 basis points2. The strong total return for BB CLOs over the first half of 2023 largely reflected interest carry, as opposed to mark-to-market price gains which might have been harder to replicate in the future. By contrast, BB corporate bonds have yields-to-maturity of just 7%, with correspondingly smaller scope for carry returns (Exhibits 2-3 below).

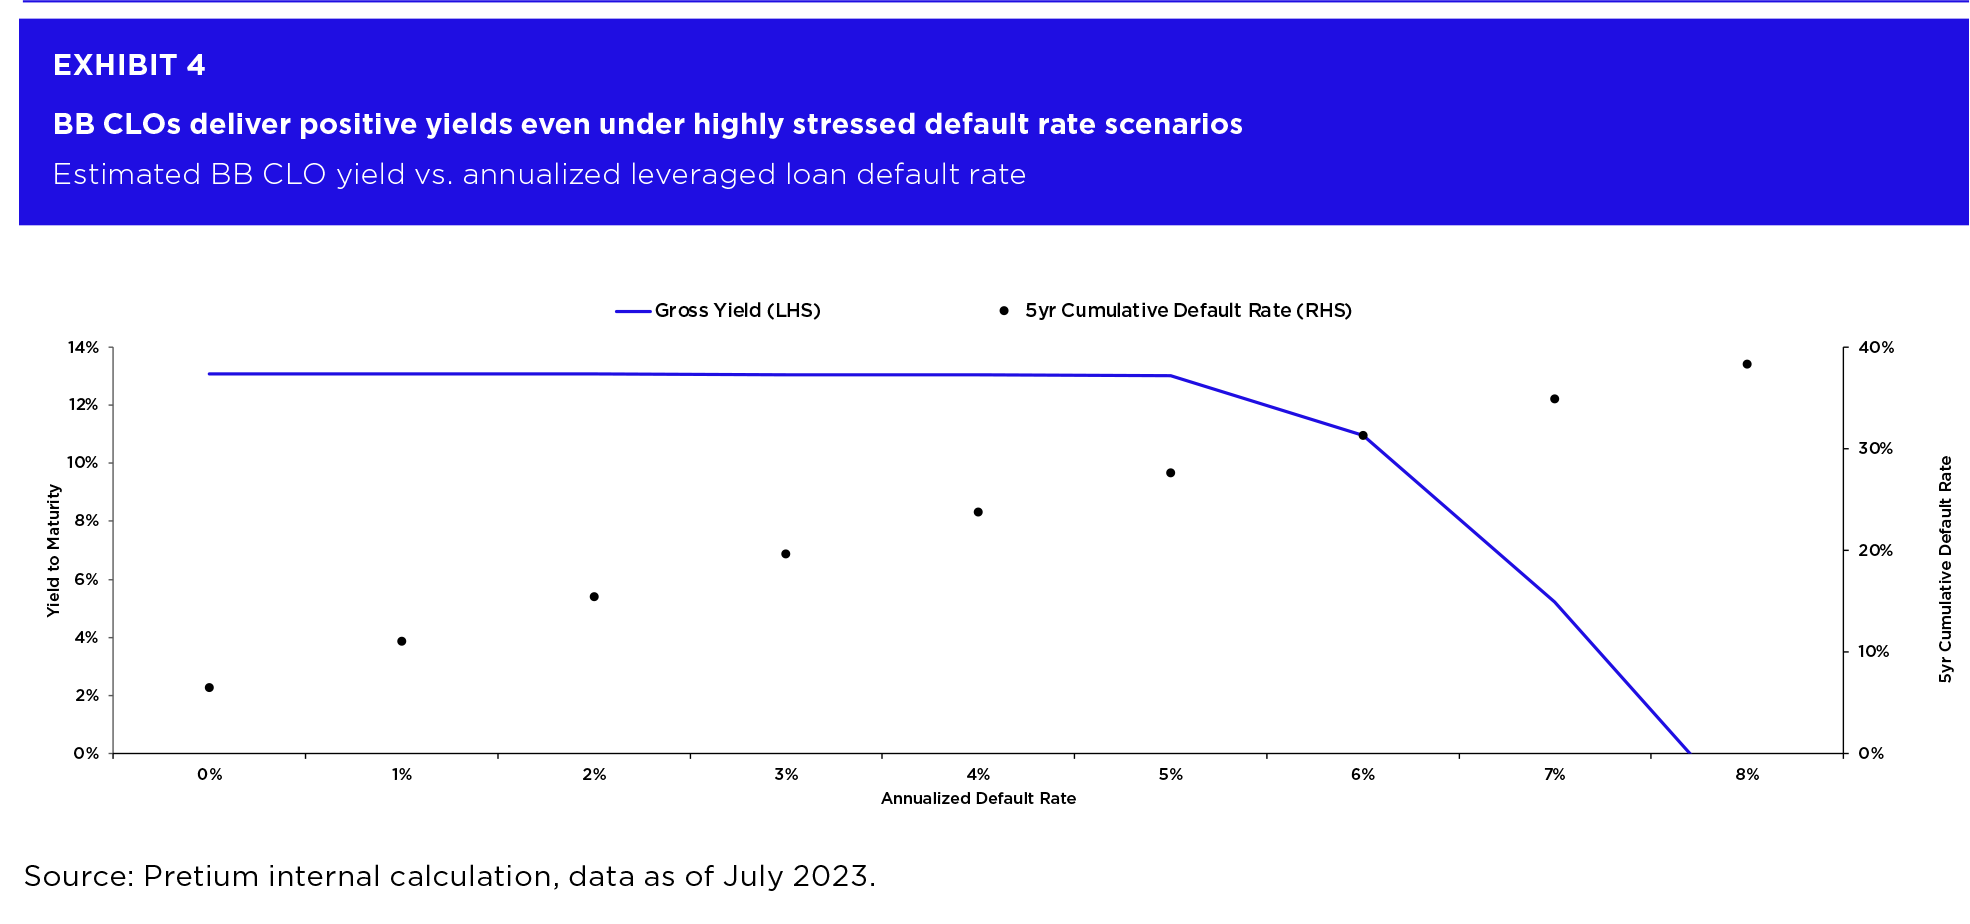
To assess the sustainability of CLO outperformance going forward in greater detail, we review expected returns for CLOs across a range of possible future interest rate and macro-economic scenarios. Our analysis suggests that mezzanine CLOs should outperform generic HY corporate bonds over a short-term (e.g., 1-year) horizon across most scenarios, with an even higher probability of outperformance over a hold-to-maturity horizon. Long-term expected returns for CLO BBs remain elevated under adverse scenarios at current pricing levels due to the fact that the investments benefit from significant structural protections which allow for full principal repayment under all but the most extreme default and recovery rate assumptions (Exhibit 4 below).

While CLO BBs can provide long-horizon downside protection in deep recession scenarios, CLO equity can complement the profile of CLO debt by offering a return distribution with significant upside potential in scenarios involving only mild recession or recovery. Combined, a portfolio which incorporates both CLO equity and CLO debt securities produces a highly attractive distribution of returns across a range of potential future economic outcomes.

Interest Rate Scenarios and Their Impacts on CLO Returns

The scenarios we include in our analysis are:

  • 1. Follow Forwards (high probability). Current interest rate curve plays out in line with current forwards, inflation continues to move down from current spot levels but remains above 2% target, unemployment ticks up modestly and corporate earnings stay flat or see a muted pullback: a soft landing scenario in which credit will outperform vs. current pricing and realized defaults are slightly below the market baseline forecast.
  • 2. Higher for Longer (high probability). Interest rates stay higher for longer, remaining close to current spot levels, inflation comes down slightly but remains elevated, unemployment ticks up and corporate earnings stay flat or see a muted pullback: a soft landing scenario in which credit will marginally outperform vs. current pricing and defaults are in-line with the market baseline forecast.
  • 3. Stubborn Inflation (low probability). The Federal Reserve hikes rates over the next twelve months in response to stubborn inflation and strong corporate earnings, inflation remains unchanged vs.current spot levels and unemployment remains low: a short term bullish market for credit with default rates lower than forecast due to strong corporate earnings.
  • 4. Hard Landing (low probability). Material economic weakness emerges in the second half of 2023, inflation trails lower towards target and unemployment becomes elevated: a hard landing scenario for the economy and credit with short term and long term default rates above baseline forecasts and pulled forward.

Further detailed assumptions regarding these scenarios, including the assumed unemployment rate, inflation rate and short and longer term interest rates, are provided in Appendix A.

The calculations of expected CLO and corporate bond returns under the alternative scenarios incorporate both projected coupon income (e.g., with lower income for floating rate CLO instruments in falling rate scenarios) combined with, over the short horizon, expected mark-to-market price changes, and, over the longer term, potential realized credit losses.

Short-Term Outlook

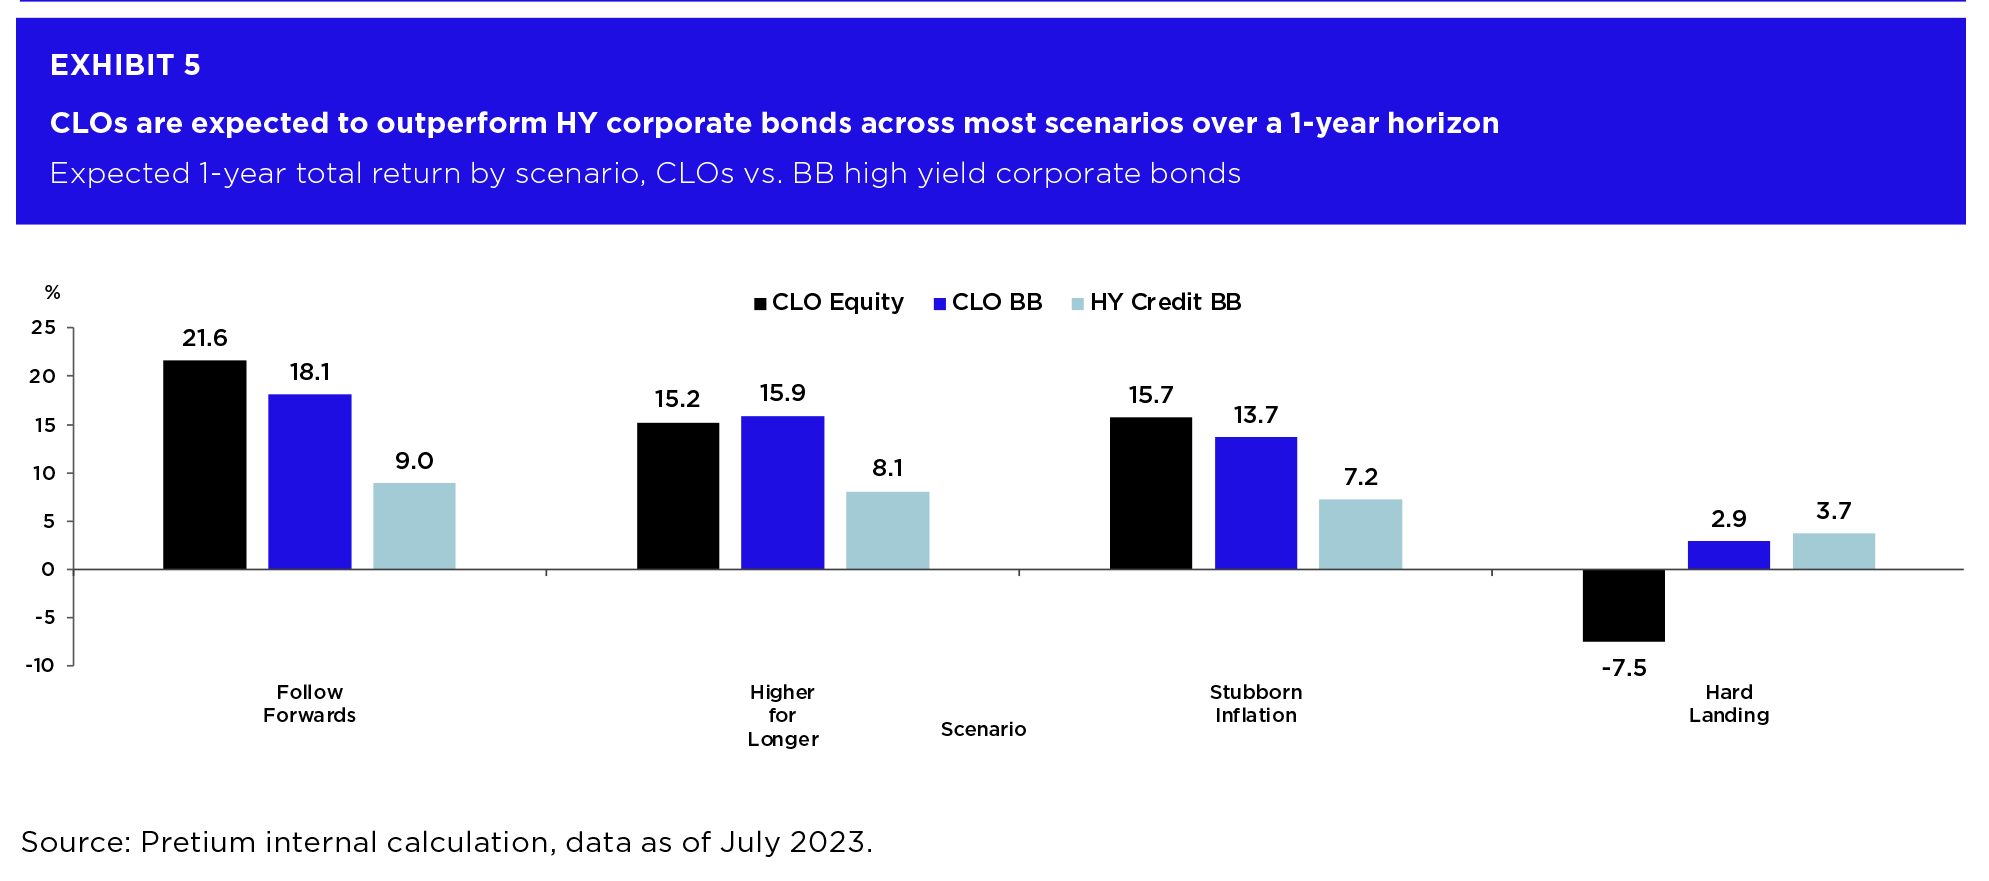
Exhibit 5 below shows the estimated scenario returns over a one-year horizon holding period. In scenarios 1 to 3 the returns for BB CLOs are projected to significantly exceed those for BB corporate bonds. This outperformance is driven by higher coupon income for CLOs. In effect, the projected outperformance of CLOs in these scenarios mirrors the recent historical outperformance of CLOs vs. HY bonds, which has also been largely driven by superior carry for the CLOs.

For scenario 4, a Hard Landing, CLO BBs are projected to deliver lower returns than fixed rate HY bonds. This modeled underperformance is a consequence of an expected decline in CLO floating rate coupons as the Federal Reserve cuts interest rates in response to an economic contraction, combined with an assumption that generic fixed rate bond spreads widen less sharply than CLO BB spreads into the contraction.

The short-term CLO equity performance estimates shown in Exhibit 5 are calculated from the cash-on-cash equity yields expected in these scenarios combined with expected instrument price changes; the price change estimates, in turn are estimated based on the historical relationships between CLO equity and HY bond prices across different market environments. In scenarios 1 to 3, CLO equity is projected to significantly outperform BB corporate bonds as high current carry is offset by only marginal changes in cash flow discount yields. Near-term changes to discount rates remain range-bound as default expectations over the first year are primarily constructed from credits that are already identified as candidates for default as a function of their current trading price. In scenario 4, CLO equity is projected to underperform as the pull-forward of defaults in credits that are currently trading above $90 is likely to result in a downward revision to forward cashflow projections combined with an increase in market yields used to discount the cashflows.

Hold-to-Maturity Outlook

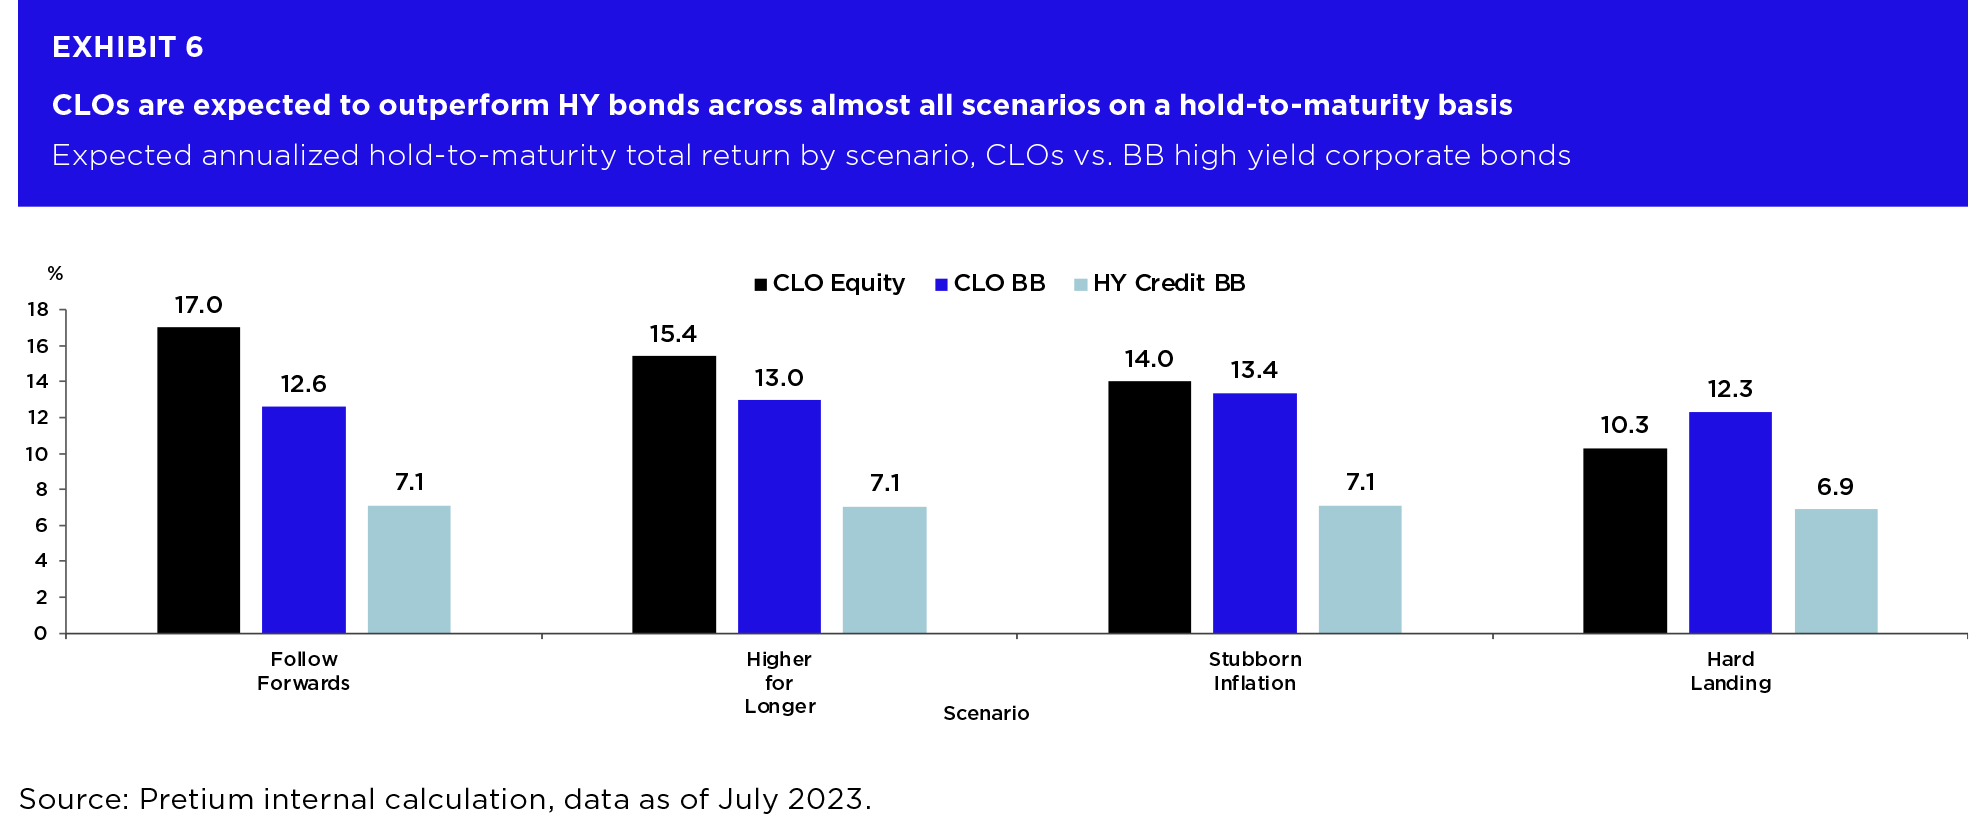
Exhibit 6 shows the expected hold-to-maturity returns for the different asset classes across scenarios. Here, CLO BBs are projected to outperform HY BB bonds across all the scenarios, including the Hard Landing. Historically, only a small percentage of BB CLOs have ever experienced principal losses, including during the global financial crisis period, due largely to the structural protections from which the bonds benefit3. Accordingly, we project no CLO BB losses under the four scenarios considered. Generic HY corporate bonds lack these structural protections and hence, are projected to experience small but non-zero performance drags due to defaults, which are modeled here as ranging from a 0.1% annualized yield degradation in the more benign scenarios to a 0.3% yield impairment in the Hard Landing scenario. Most of the projected BB CLO vs. BB corporate bond outperformance though, comes not from differences in credit loss assumptions but rather, from the substantially wider spreads CLO BBs currently contain, which helps generate much stronger carry income over the lives of the respective bonds.

While CLO debt is seen in Exhibit 6 to provide high prospective yields and significant long-horizon downside protection, CLO equity offers a return distribution with significant upside potential in scenarios involving milder recession or recovery. For example, in the Follow Forwards scenario, CLO equity would be expected to deliver a 17% annualized return. Combined, a portfolio incorporating CLO equity and CLO BB securities can produce a risk-return profile superior to those available in public equity or single-name HY credit markets.

The hold-to-maturity CLO equity performance estimates in Exhibit 6 are based on IRR calculations which project CLO equity cash flows under the alternative scenarios. The modeled CLO equity held-to-maturity return is lowest in the Hard Landing scenario, in which loan default rates are assumed to be relatively elevated and CLO equity cash flows are consequently reduced. Lower interest rates in this scenario also put downward pressure on CLO equity cash flows in this adverse scenario. Even in the Hard Landing scenario however, we project a portfolio of CLO equity securities to ultimately deliver low double-digit IRRs given the currently favorable pricing of these instruments

Summary

Our analyses suggest that the strong total returns delivered by CLO mezzanine debt and equity securities in the first half of 2023 are sustainable going forward given current pricing. An analysis of the projected returns for CLOs vs. fixed rate HY corporate bonds suggests that CLOs should outperform over a 1-year horizon across most economic scenarios, with outperformance even more probable over longer holding periods. Pretium believes the attractive relative value provided by a portfolio of CLO equity and CLO BBs clearly indicates that CLOs should be an integral component for every allocator looking to optimize their corporate credit exposure in this environment.

Appendix A — Economic scenario assumptions


1 Source: Bank of America, Bloomberg, JPM, data as of June 30, 2023.
2 Source: JPM CLOIE, data as of July 17, 2023.
3 Source: “CLO Performance”, Federal Reserve Bank of Philadelphia, WP 20-48, November, 2021.

Disclosure

This confidential presentation was prepared exclusively by Pretium for the benefit and internal use of the party to whom it is directly addressed and delivered (the “Recipient”). None of the materials, nor any content, may be altered in any way, transmitted to, copied, reproduced or distributed in any format in whole or in part to any other party without the prior express written consent of Pretium. As used in this presentation, “Pretium” refers to Pretium Partners, LLC and/or its affiliates.

Pretium’s Credit investment strategies are focused on corporate credit, structured products collateralized by corporate credit, and legal opportunities financing. The team invests in broadly syndicated loans, as well as securities issued by CLOs. Investments in non-investment grade companies are subject to greater risk of loss of principal and interest than higher-rated investments and are generally considered to be predominantly speculative with respect to the issuer’s capacity to pay interest and repay principal. Litigation finance depends on whether the cases in which the fund invests will be successful, will pay the targeted returns and will pay those returns in the anticipated time. Assessing the values, strengths and weaknesses of a case is complex and the outcome is not certain. Should cases, claims, defenses or disputes in which the fund invests prove to be unsuccessful or produce returns below those expected, the performance of the fund could be materially adversely affected. Furthermore, laws and professional regulations in litigation funding can be complex and uncertain and details of certain cases are unlikely to be disclosed because of confidentiality and other restrictions.

There can be no assurance that Pretium’s objectives will be achieved, that any risk management will adequately protect against downside losses, or that an investor will receive any return on its investment. An investment should only be considered by persons who can afford a loss of their entire investment. Past activities of investment entities sponsored by Pretium provide no assurance of future results. Past or targeted performance is not a guarantee, projection or prediction and is not necessarily indicative of future results.

These materials do not constitute, or form part of, any offer to sell or issue interests in an investment vehicle or any other entity. Any such offer or solicitation will be made solely by means of a definitive offering document, which will describe the actual terms of any securities offered and will contain material information regarding the securities. Any information contained herein will be superseded by information delivered to Recipient as part of an offering document. No representation, warranty or undertaking, express or implied, is given as to the accuracy or completeness of the information or opinions contained herein.

Past performance is not necessarily indicative of future results and there can be no assurance that targeted returns will be achieved. There can be no assurance that Pretium will achieve results comparable to or that the returns generated will equal or exceed those of other investment activities of Pretium or that Pretium will be able to implement its investment strategy or achieve its investment objectives. Pretium does not make any representation or warranty, express or implied, regarding future performance.

Certain information contained in these materials constitute “forward-looking statements,” which can be identified by the use of forward-looking terminology such as “may,” “will,” “should,” “seek,” “expect,” “anticipate,” “project,” “estimate,” intend,” continue,” “target,” “plan,” “believe,” the negatives thereof, other variations thereon or comparable terminology. Due to various risks and uncertainties, actual events or results of the actual performance of an investment vehicle or strategy may differ materially from those reflected or contemplated in such forward-looking statements.

Certain information contained in this presentation has been obtained from published and non-published sources prepared by third parties, which, in certain cases, have not been updated through the date hereof. While such information is believed to be reliable, Pretium has not independently verified such information nor does it assume any responsibility for the accuracy or completeness of such information. Except as otherwise indicated herein, the information, opinions and estimates provided in this presentation are based on matters and information as they exist as of the date these materials have been prepared and not as of any future date and will not be updated or otherwise revised to reflect information that is subsequently discovered or available, or for changes in circumstances occurring after the date hereof.

These materials are intended to assist the Recipient in connection with its due diligence and to assist the Recipient in understanding the strategies that Pretium intends to pursue to seek to maximize portfolio performance. They are not intended as a representation or warranty by Pretium as to the actual composition or performance of any future investments that would be made by Pretium. Assumptions necessarily are speculative in nature. It is likely that some or all of the assumptions underlying the potential investments will not materialize or will vary significantly from any assumptions made (in some cases, materially so). The Recipient should understand such assumptions and evaluate whether they are appropriate for its purposes.

Recipients should note that COVID-19 has, among other things, significantly diminished global economic production and activity of all kinds and has contributed to both volatility and a decline in all financial markets. The ultimate impact of COVID-19 — and the resulting precipitous and near-simultaneous decline in economic and commercial activity across several of the world’s largest economies — on global economic conditions, and on the operations, financial condition and performance of any particular industry or business, is impossible to predict, although ongoing and potential additional materially adverse effects, including a further global or regional economic downturn (including a recession) of indeterminate duration and severity, are possible. The extent of COVID-19’s impact will depend on many factors, including the ultimate duration and scope of the public health emergency and the restrictive countermeasures being undertaken, as well as the effectiveness of other governmental, legislative and financial and monetary policy interventions designed to mitigate the crisis and address its negative externalities, all of which are evolving rapidly and may have unpredictable results. Even if and as the spread of the COVID-19 virus itself is substantially contained, it will be difficult to assess what the longer-term impacts of an extended period of unprecedented economic dislocation and disruption will be on future macro- and micro-economic developments, the health of certain industries and businesses, and commercial and consumer behavior.

SCI Pretium – Mezz Opportunities

INSIGHTS

SCI Pretium - Mezz Opportunities

July 2023

Pretium structured credit and CLO liabilities MD Ian Wolkoff and Director Marty Young argue that mezzanine CLO bonds should be on the radar screens of most asset allocators with long investment horizons.

Mezz opportunities

Pretium structured credit and CLO liabilities MD Ian Wolkoff and Director Marty Young argue that mezzanine CLO bonds should be on the radar screens of most asset allocators with long investment horizons

US CLO mezzanine debt offers high expected return rates, with yields maintained under a default scenario more extreme than the GFC credit cycle and with upside potential in a market recovery scenario.

CLO debt offers strong long-run expected returns with bounded downside

In the current market context, macro uncertainty and the potential for a growth downturn loom large while valuations across many sectors still screen as relatively expensive. Given this set-up, asset allocators are searching even more actively than usual for investment opportunities which offer high potential yields but with contained downside protection in bearish scenarios. CLO mezzanine debt is a sector which appears to offer this combination.

The US CLO market has grown to over US$950bn in outstanding balance, with over US$160bn of balance in mezzanine (single-A through single-B) tranches. As a result, a CLO mezzanine debt strategy addresses a market large enough to allow investors to allocate selectively while still targeting high yields with contained risks.

Yields on CLO mezzanine debt securities have moved up sharply over the past two years; double-B CLO bonds purchased in the secondary market offer average lifetime quoted yields of 14.4% as of June 2023 versus 7.7% in mid-2021. The current baseline yields for double-B CLOs compare quite favourably to the yields available from other similarly rated fixed income assets: double-B leveraged loans and double-B corporate bonds, for example, currently yield just 7.6% and 7.2% respectively.

The extra yield earned by double-B CLOs versus double-B corporate bonds does not appear to reflect added default risk as the comparison holds debt ratings constant; indeed, during the 2008 financial crisis episode, CLO bonds had significantly lower default rates than similarly rated corporate bonds. CLO transactions are designed so that the bond classes can withstand elevated default rates on the underlying loan portfolios without taking principal losses; the double-B CLO bonds benefit from multiple structural protections, including overcollateralisation and excess spread that absorb losses before they can be passed to the double-B bonds.

A price-yield analysis of a double-B tranche from a sample 2021 vintage CLO transaction indicates that the double-B bond yield remains in double-digits under a scenario in which 28% of the underlying loan assets default over the next five years with a 60% recovery rate – a default intensity over 1.6 times the five-year cumulative default rate experienced following the global financial crisis. Indeed, the double-B tranche yield remains positive, even if the assumed five year cumulative loan default rate rises to 35%, more than 2x the level seen during 2007-2013. CLO double-B bond yields remain positive in this high default rate scenario, despite the fact that much of the bond principal would be projected to be written down in such an event, as the high projected coupon payments over the lifetime of the bond would compensate for the principal loss.

CLO debt offers upside potential in a market recovery scenario

Per above, double-B CLOs can offer around 14% yields under a moderate recession baseline scenario. The bonds can maintain these double-digit yields in a loss scenario comparable to that experienced during the global financial crisis and can continue to earn positive yields in scenarios significantly more extreme than in 2008. Thus, the long-run downside risk for the majority of bonds in the double-B CLO sector, while not zero, appears bounded.

At the same time, the bonds provide meaningful potential return upside in a scenario in which double-B CLO spreads partially normalise relative to their current wide levels. Double-B CLO spreads are currently trading 250bp above the level that would be predicted, given their historical relationship to high yield corporate bond spreads. If 60% of this pricing anomaly were to be slowly corrected over a two-year period, the double-B CLO horizon yields would be expected to reach around 18%, with 14% of the yield coming from coupon income and 4% from price appreciation.

Summary

Mezzanine CLO yields are currently elevated relative to the yields available on comparably rated corporate bonds. While CLO bonds may experience short-term mark-to-market price volatility, over a longer-term horizon, yields would be expected to remain in double-digits across a wide range of loss scenarios – including scenarios featuring default rates more extreme than those that were realised during the challenging 2007-2013 period.

At the same time, mezzanine CLO bonds offer realistic chances of return upside if bond spreads partially revert back to more historically typical levels. Given this favourable risk/return profile for mezzanine CLO debt, Pretium believes the sector should be on the radar screens of most asset allocators with long investment horizons.

Based on Pretium’s research, data and estimates from publicly available sources. Statements throughout these materials, including those regarding the market, represent the opinions and beliefs of Pretium. There can be no assurance that these will materialise.

This article was published in Structured Credit Investor on 28 June 2023.

Long-Term Bullish Outlook for the Housing Rehabilitation Industry

INSIGHTS

Long-Term Bullish Outlook for the Housing Rehabilitation Industry

May 2023

The aging U.S. housing stock, slow new home construction pace, and postpandemic shifts in housing utilization create strong tailwinds for housing rehabilitation and remodeling activity

Rehabitation and remodeling are important tools in addressing the U.S. housing undersupply problem

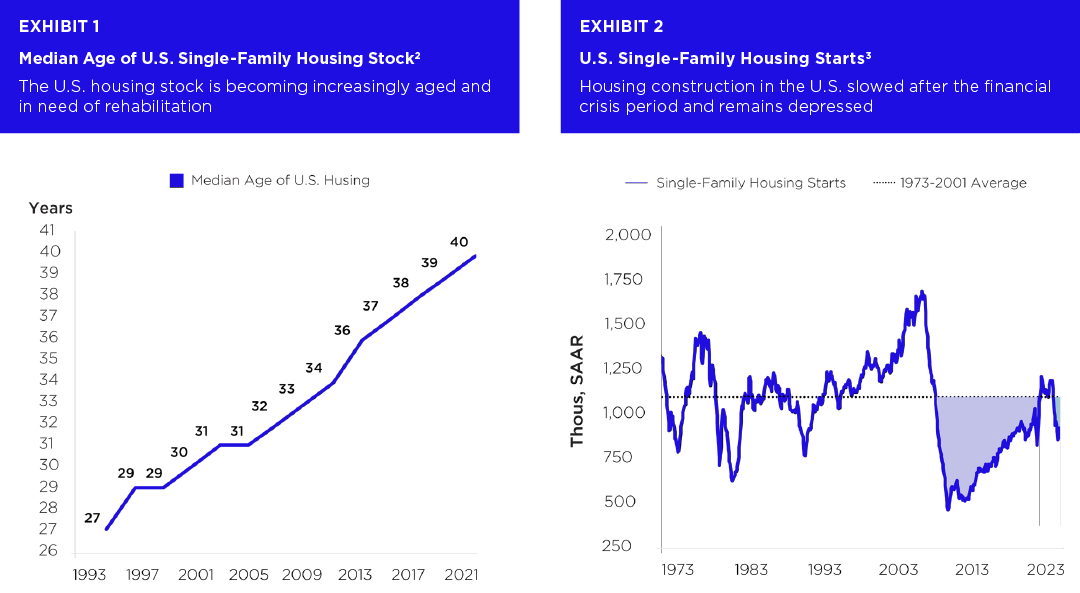
A recent Harvard study notes that across the U.S., 49% of owner-occupied housing was built before 1980; in certain geographic areas – including Boston, New York and Los Angeles – two-thirds or more of the owner-occupied homes were built before 1980.1 The aging of the U.S. housing stock is a consequence of the sharp slowdown in new home construction that began in 2007 and that has extended through 2023, per Exhibits 1-2 below.

The continued aging and deterioration of the U.S. housing stock points to a large market of homes in need of rehabilitation. The 2023 Harvard study notes that recent improvement spending has focused not just on cosmetic enhancements but has also been directed at core replacements of basic housing components including roofing and HVAC systems which have extended beyond their functional lifetimes.1 Pretium and our affiliated lending partner Anchor Loans believe that modernization and rehabilitation of the already existing U.S. housing stock will play an important role in addressing the general problem of housing undersupply across the country. Further, it is likely that the extensive amount of modernization required for many homes will be difficult for typical homeowners to manage and finance; rather, such extensive rehabilitation will often be most conveniently executed by professional developers who purchase homes for sale, bring them up to modern standards, and then subsequently resell the homes once the improvements are complete.

Post-pandemic shifts in living patterns provide additional positive impulse for home improvement

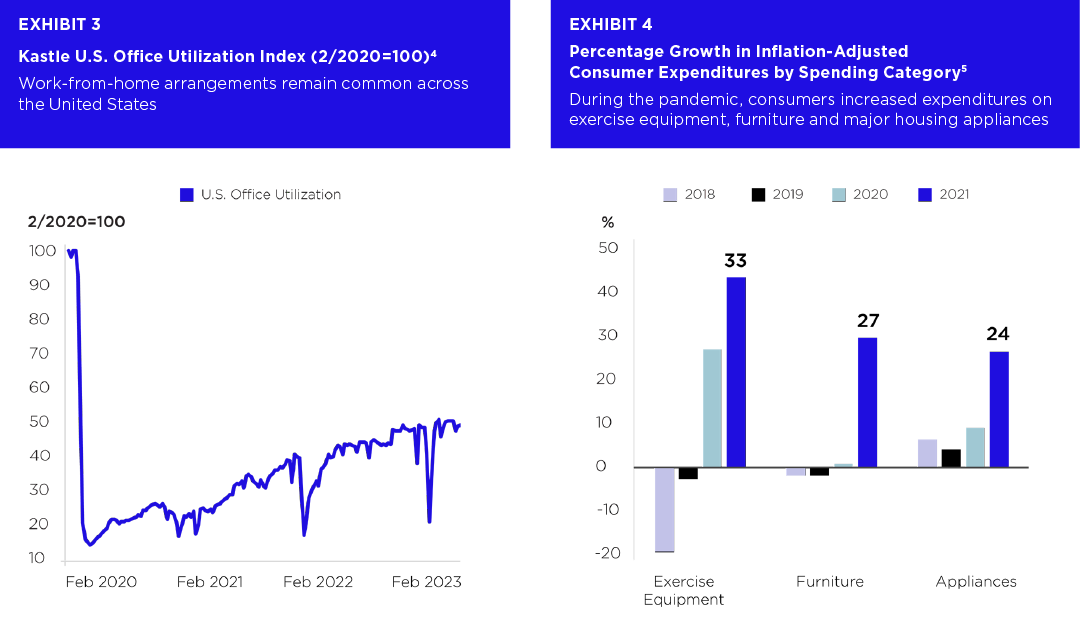
Post-pandemic changes in patterns of housing activity are another force that is likely to put upward pressure on the demand for home improvements. Measures of U.S. office space occupancy remain at below 50% of pre-COVID levels, now three years after the initial pandemic shock (Exhibit 3), suggesting that the move towards work-from-home has become structural. Exhibit 4 relatedly shows a large increase in inflation-adjusted consumer spending on categories such as exercise equipment and furniture since the start of the pandemic. With the growing amount of both work and leisure activity taking place at home, homeowners will demand newer and better housing features that can support these pursuits. Again, it is likely that the extensive home remodeling needed to bring housing quality and size up to the level that can facilitate increased home-centered living activity will often be most efficiently executed by professionals with access to scale economies and efficient and stable financing vehicles.

Demographic trends are supportive of housing rehabilitation

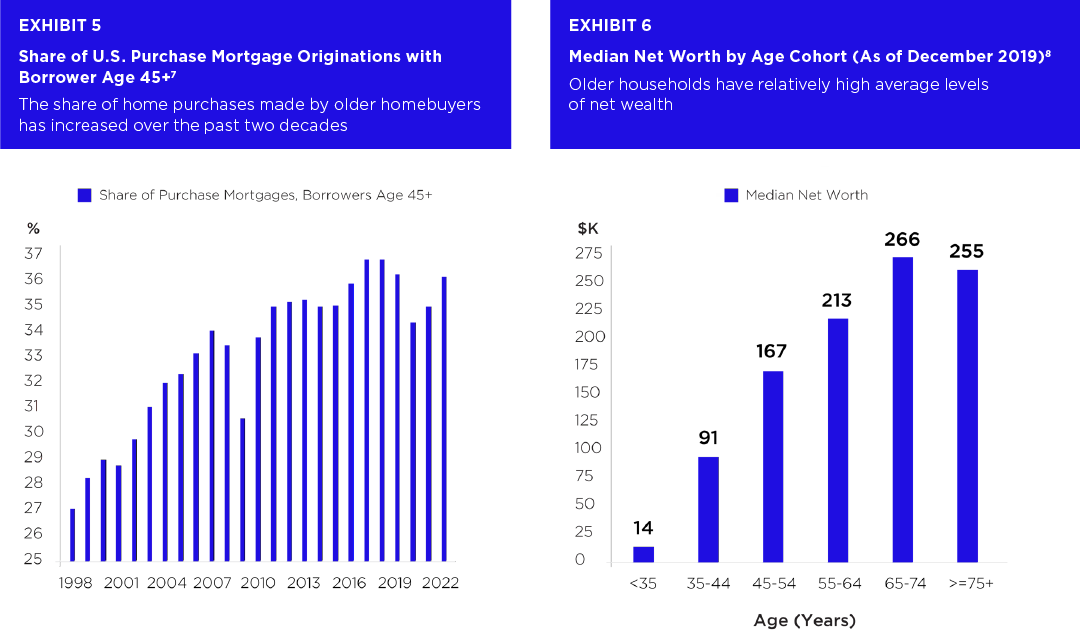
Not only is the U.S. housing stock aging, the population of U.S. homeowners and homebuyers is aging as well. The National Association of Realtors has noted that over 40% of all the 2022 U.S. home purchases were made by homebuyers from the so-called baby-boomer or silent generation cohorts6; per Exhibit 5, the share of homes purchased by older homebuyers has trended higher over the past two decades. An older homebuying population will likely be supportive of housing rehabilitation activity: the Harvard home improvement study notes that older homeowners will tend, for example, to value homes modified for improved accessibility and safety. Older homebuyers also have relatively high levels of average net wealth, per Exhibit 6 below, to help facilitate the purchase of improved homes.

The aging of the U.S. housing stock, combined with post-pandemic shifts in lifestyles that benefit from expanded and modernized single-family housing, and demographic trends leading towards an elevated share of older homebuyers, are strong tailwinds for the housing rehabilitation industry. Pretium and Anchor Loans remain constructive on the long-term outlook for the professional home improvement sector and look forward to playing a role in the ongoing process of rehabilitation of the U.S. housing supply.

This is not an offer, advertisement, or solicitation for interests in any Pretium managed vehicle and should not be construed or relied upon as investment advice or as predictive of future market or investment performance. Past performance is not indicative of future results.


1. “Improving America’s Housing 2023”, Harvard Joint Center for Housing Studies, March 2023.
2. American Community Survey, Pretium. Data as of December 2021.
3. Census Bureau, Pretium. Data as of February 2023.
4. Kastle, Pretium. Data as of April 2023.
5. BLS, Pretium. Data as of December 2021.
6. “2022 Home Buyers and Sellers Generational Trends Report”, NAR, March 2023. Boomer and Silent Gen cohorts are defined as the groups born during 1946-1964 and 1925-1945, respectively.
7. FHFA National Mortgage Database Program, Pretium. Data through June 30, 2022.
8. “2022 Home Buyers and Sellers Generational Trends Report”, NAR, March 2023.

Pretium’s Second State of ESG Report

INSIGHTS

Pretium's Second State of ESG Report

April 2023

The past year of our environmental, social, and governance journey features milestones for Pretium and our operating companies.

We believe sound ESG principles and practices can help maximize returns to our investors by having a positive impact on our employees, our residents, our borrowers, the communities in which we operate, and the businesses we serve.

Opportunities for Generating Alpha in the U.S. CLO Market

INSIGHTS

CLO Performance Report, April 2023

April 6, 2023

U.S. CLO debt offers high average yields due to persistent complexity and liquidity premiums, with return dispersion providing opportunities for generating alpha through active management

CLO debt offers strong average returns due to persistent complexity and liquidity premiums

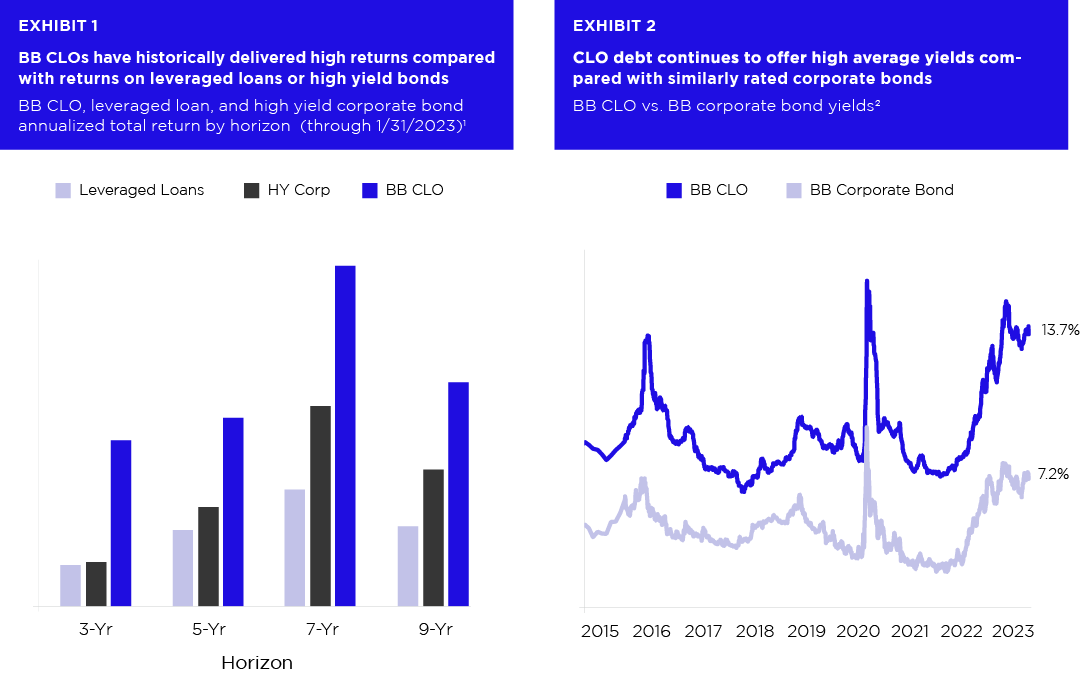
CLO debt securities have historically delivered strong positive returns across a wide range of economic environments: Exhibit 1, below, shows that BB-rated CLO bonds have outperformed leveraged loans and high yield corporate bonds over the past 3-year, 5-year, 7-year and 9-year horizons. Pretium believes CLO debt has the potential to continue to outperform other assets with comparable ratings profiles: Exhibit 2, for example, shows that BB CLOs currently offer average yields of 13.7%, 6.5% above the yields available on similarly rated corporate bonds. Exhibits 1 and 2 represent the average opportunity accessible through the CLO market – that is, by passively allocating to the entire universe of outstanding BB CLO debt instruments, an investor can earn high average returns relative to the returns available from competing asset classes due to the persistent presence of a CLO complexity premium.
CLO debt offers significant alpha opportunities

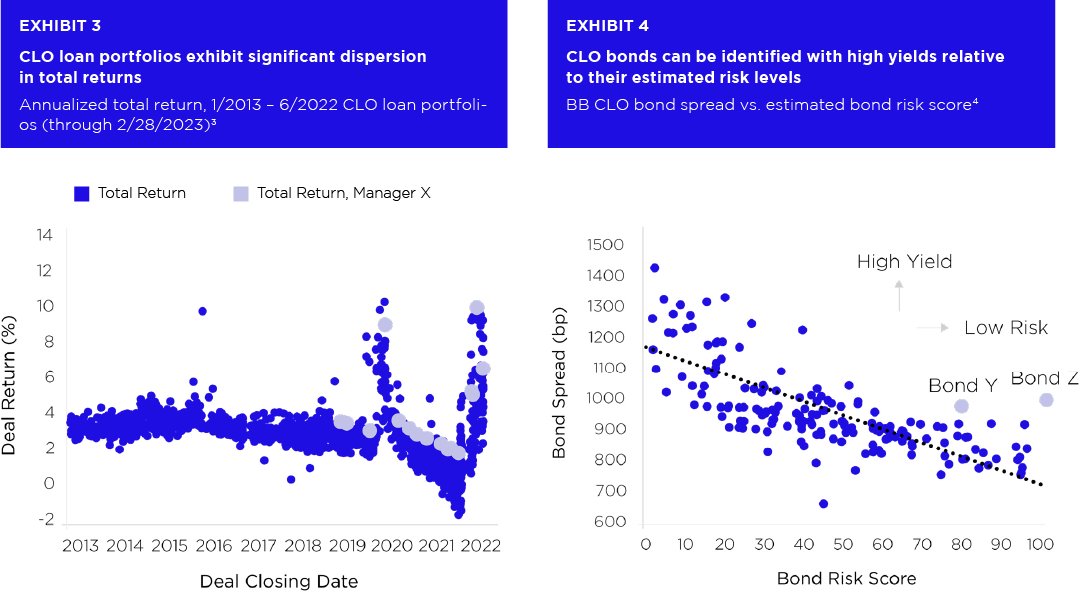
In addition to the opportunity for earning strong average index-level returns, the CLO market also features a meaningful amount of return dispersion across different CLO transactions; as a result, there is potential for earning additional alpha returns through judicious active selection of specific CLO bonds. Exhibit 3, for example, shows the annualized total unlevered returns of the underlying loan portfolios for the population of CLOs issued between 2013 and 2022: for a typical quarterly vintage of CLO transactions (e.g., those issued in 2019Q2), the range of loan portfolio returns exceeds 200bp. Given the degree of natural leverage embedded within CLO transaction structures, this amount of return dispersion across loan portfolios translates into an even larger amount of dispersion in returns for junior CLO debt and equity tranches, providing an alpha-rich environment for active CLO investors.

Exhibit 3 highlights one potential means by which active CLO bond investors might outperform the index – namely, by identifying specific CLO managers whose loan portfolios consistently manage to deliver high average returns. In this Exhibit, the loan portfolio returns delivered by one particular CLO manager, here labeled as “Manager X”, are seen to frequently come in near the high ends of the ranges of returns of CLOs issued in nearby time periods. CLO bond investors with tools for and expertise in monitoring CLO manager performance may thus be able to generate alpha by over-allocating to CLO bonds issue by such high-performing managers.

Exhibit 4 shows an alternative sample screen that may be used to actively select CLO bonds with high return potential. The chart in this Exhibit compares the yields on BB CLO bonds traded in the secondary market in the month of February 2023 to a proprietary quantitative measure of risk levels of the bonds. The bond yield and the aggregated risk measure levels are fairly highly correlated, with high risk bonds usually trading at wide spread levels, suggesting the CLO market is roughly efficient. However, there are bonds, such as the ones labeled “Bond Y” and “Bond Z” in the chart, which appear to have high yields relative to the measured amount of risk. CLO investors aided by tools that can similarly help identify bonds with high risk-adjusted yields thus have the potential to generate positive alpha and deliver returns above those earned by the broad CLO index.
The CLO asset class has grown significantly over the past two decades, in large part because of the consistently strong performance of the sector through a wide range of economic scenarios including the global financial crisis episode. The CLO sector offers strong index-level return potential given the high average yields available across the sector’s bonds; there are also meaningful opportunities for earning alpha, or extra returns above the average CLO index, via active management. The potential for earning high returns from CLOs in the current environment suggests that many investors who allocate to sectors such as high yield corporate bonds could benefit from investing as well in CLO debt.

Confidentiality and Other Important Disclosures

This confidential presentation was prepared exclusively by Pretium for the benefit and internal use of the party to whom it is directly addressed and delivered (the “Recipient”). None of the materials, nor any content, may be altered in any way, transmitted to, copied, reproduced or distributed in any format in whole or in part to any other party without the prior express written consent of Pretium. As used in this presentation, “Pretium” refers to Pretium Partners, LLC and/or its affiliates.

Pretium’s Credit investment strategies are focused on corporate credit, structured products collateralized by corporate credit, distressed debt and equity and legal opportunities financing. The team invests in broadly syndicated loans, debt and equity of public and private companies, as well as securities issued by CLOs. Investments in high yield securities are subject to greater risk of loss of principal and interest than higher-rated securities and are generally considered to be predominantly speculative with respect to the issuer’s capacity to pay interest and repay principal. Investments in distressed situations expose the investor to the difficulty in obtaining information as to the issuer’s true condition; legal risk, including laws relating to fraudulent conveyances, voidable preferences, lender liability, and bankruptcy; litigation risk; and liquidity risk. In addition, accounts will not be diversified among a wide range of types of securities, industry, markets, or countries. Litigation finance depends on whether the cases in which the fund invests will be successful, will pay the targeted returns and will pay those returns in the anticipated time. Assessing the values, strengths and weaknesses of a case is complex and the outcome is not certain. Should cases, claims, defenses or disputes in which the fund invests prove to be unsuccessful or produce returns below those expected, the performance of the fund could be materially adversely affected. Furthermore, laws and professional regulations in litigation funding can be complex and uncertain and details of certain cases are unlikely to be disclosed because of confidentiality and other restrictions.

There can be no assurance that Pretium’s objectives will be achieved, that any risk management will adequately protect against downside losses, or that an investor will receive any return on its investment. An investment should only be considered by persons who can afford a loss of their entire investment. Past activities of investment entities sponsored by Pretium provide no assurance of future results. Past or targeted performance is not a guarantee, projection or prediction and is not necessarily indicative of future results.

These materials do not constitute, or form part of, any offer to sell or issue interests in an investment vehicle or any other entity. Any such offer or solicitation will be made solely by means of a definitive offering document, which will describe the actual terms of any securities offered and will contain material information regarding the securities. Any information contained herein will be superseded by information delivered to Recipient as part of an offering document. No representation, warranty or undertaking, express or implied, is given as to the accuracy or completeness of the information or opinions contained herein.

Past performance is not necessarily indicative of future results and there can be no assurance that targeted returns will be achieved. There can be no assurance that Pretium will achieve results comparable to or that the returns generated will equal or exceed those of other investment activities of Pretium or that Pretium will be able to implement its investment strategy or achieve its investment objectives. Pretium does not make any representation or warranty, express or implied, regarding future performance.

Certain information contained in these materials constitute “forward-looking statements,” which can be identified by the use of forward-looking terminology such as “may,” “will,” “should,” “seek,” “expect,” “anticipate,” “project,” “estimate,” intend,” continue,” “target,” “plan,” “believe,” the negatives thereof, other variations thereon or comparable terminology. Due to various risks and uncertainties, actual events or results of the actual performance of an investment vehicle or strategy may differ materially from those reflected or contemplated in such forward-looking statements.

Certain information contained in this presentation has been obtained from published and non-published sources prepared by third parties, which, in certain cases, have not been updated through the date hereof. While such information is believed to be reliable, Pretium has not independently verified such information nor does it assume any responsibility for the accuracy or completeness of such information. Except as otherwise indicated herein, the information, opinions and estimates provided in this presentation are based on matters and information as they exist as of the date these materials have been prepared and not as of any future date and will not be updated or otherwise revised to reflect information that is subsequently discovered or available, or for changes in circumstances occurring after the date hereof.

These materials are intended to assist the Recipient in connection with its due diligence and to assist the Recipient in understanding the strategies that Pretium intends to pursue to seek to maximize portfolio performance. They are not intended as a representation or warranty by Pretium as to the actual composition or performance of any future investments that would be made by Pretium. Assumptions necessarily are speculative in nature. It is likely that some or all of the assumptions underlying the potential investments will not materialize or will vary significantly from any assumptions made (in some cases, materially so). The Recipient should understand such assumptions and evaluate whether they are appropriate for its purposes.

Recipients should note that COVID-19 has, among other things, significantly diminished global economic production and activity of all kinds and has contributed to both volatility and a decline in all financial markets. The ultimate impact of COVID-19 — and the resulting precipitous and near simultaneous decline in economic and commercial activity across several of the world’s largest economies — on global economic conditions, and on the operations, financial condition and performance of any particular industry or business, is impossible to predict, although ongoing and potential additional materially adverse effects, including a further global or regional economic downturn (including a recession) of indeterminate duration and severity, are possible. The extent of COVID-19’s impact will depend on many factors, including the ultimate duration and scope of the public health emergency and the restrictive countermeasures being undertaken, as well as the effectiveness of other governmental, legislative and financial and monetary policy interventions designed to mitigate the crisis and address its negative externalities, all of which are evolving rapidly and may have unpredictable results. Even if and as the spread of the COVID-19 virus itself is substantially contained, it will be difficult to assess what the longer-term impacts of an extended period of unprecedented economic dislocation and disruption will be on future macro- and micro-economic developments, the health of certain industries and businesses, and commercial and consumer behavior.


1. Bloomberg, Markit, Palmer Square, Pretium. Leveraged loan, high yield bond, and CLO returns are derived from the Markit iBoxx USD Liquid Leveraged Loans Total Return Index, the Bloomberg High Yield Corporate Bond Total Return Index, and the Palmer Square BB CLO Total Return Index, respectively, Data as of January 2023. Bloomberg, Pretium. Data as of February 2023.
2. Bloomberg, Pretium. Data as of February 2023.
3. Pretium. Data as of January 2023.
4. Pretium. Data as of February 2023.

advanced-floating-content-close-btn 

June 2022

Pretium’s State of ESG Report

Read here to learn more.